Categories
Tire Sidewall

How AI Tire Scanning Improves Quality Control & Compliance

Whether you manage quality on a tire production line, oversee fleet maintenance compliance, or run a tire recycling facility, the demands on your documentation and inspection processes are growing  fast. 

Regulators are tightening. The EPA and state agencies such as CalRecycle and TCEQ are pushing for digital tracking of waste tires. The European Union’s product passport framework already applied to batteries  is expected to extend to tires by 2027–2028, requiring end-to-end traceability from manufacturing through end-of-life recycling. At the same time, the global tire inspection system market is expanding rapidly, valued at USD 238.6 million in 2025 and projected to reach USD 336.6 million by 2035, driven largely by stricter regulatory requirements and Industry 4.0 adoption. 

The compliance burden is real, and manual inspection processes aren’t keeping pace. AI-powered tire scanning reassures quality and compliance managers that defect detection and accuracy are significantly improved, providing confidence in meeting regulatory standards. 

Why Manual Tire Inspection Creates Compliance Risk 

Traditional tire quality control has relied on a combination of manual visual inspection, physical testing, and paper-based or manually entered records. The limitations of this approach are well-documented and significant. 

Each year, approximately 7% of tires produced are returned as defective, resulting in around $100 million in restitution costs for the tire industry. This figure represents the expenses associated with unidentified defects before the tires left the manufacturing facility. The primary issue stems from production capacity: as production volumes rise and the demand for rapid defect detection increases, human inspection becomes a bottleneck. This approach not only decreases production efficiency but also compromises product quality. 

The problem compounds on the compliance side. For tire recyclers operating under state manifest requirements, missing or incomplete tire manifests, incorrect or unreadable DOT codes on sidewalls, and inconsistent reporting between transporters and processors are among the most common compliance failures. Fines under CalRecycle and TCEQ mandates can reach $25,000 per violation, with additionalpenalties for repeat offenders a cost that makes a strong business case for automation on its own. 

The compliance gap isn’t about intent. It’s about the structural limits of manual processes applied at an industrial scale. 

What AI Tire Scanning Actually Does 

AI-powered tire scanning encompasses several distinct technologies, each addressing different parts of the quality and compliance workflow. 

AI-powered vision systems on production lines use high-resolution cameras combined with machine learning algorithms to inspect every tire as it moves through the manufacturing process. While these systems significantly reduce human error, they may require initial calibration and ongoing maintenance to ensure optimal performance. These systems can detect anomalies such as sidewall imperfections, tread pattern inconsistencies, or internal structural issues in real time unlike manual inspections, which might miss subtle defects. AI evaluates every tire with the same level of scrutiny, 24/7, and without fatigue. 

X-ray and laser-based AI inspection go deeper than surface-level scanning. By learning from thousands of images and historical data points, AI can spot defect patterns and predict failures that might otherwise go unnoticed. Internal defects foreign objects, structural anomalies, delamination are invisible to the naked eye but detectable through AI-enhanced X-ray analysis. Deep learning models now achieve accuracy above 94% in real-world tire defect detection, setting a new benchmark that manual inspection cannot match. 

DOT code and sidewall scanning addresses one of the most persistent compliance pain points. Optical character recognition (OCR) and computer vision help automatically read tire sidewall markings, including Department of Transportation (DOT) codes, tire sizes, and manufacturing dates and modern AI systems can read these markings even under dirt, low light, or surface damage that would defeat a manual read. Each scan produces structured, tamper-proof digital data ready for audit review, eliminating the transcription errors that create compliance gaps in paper-based workflows. 

Label and marking verification is another area where AI adds significant value for manufacturers. Vision AI systems use high-resolution cameras to capture detailed images of tire labels. They can instantly validate label information against pre-set standards and databases catching labeling errors before non-conforming tires reach the market. 

Building a Compliant, Audit-Ready Record at Scale 

For a compliance manager, the value of AI tire scanning isn’t just detection accuracy it’s the quality and structure of the data record it creates. 

Manual scan or inspection processes create records that are only as good as the person entering the data at that moment. AI systems automatically generate consistent, structured records, supporting compliance managers by reducing manual effort and minimizing errors. 

The same infrastructure that supports compliance reporting also powers proactive quality management. When a defect pattern emerges whether in a batch of tires from a specific production run or from a particular input supplier  the AI system’s traceability data enables immediate isolation of affected units, rather than waiting for a recall. This process is root cause analysis at a speed that manual records cannot support. 

Looking further ahead, the EU’s anticipated tire product passport requirement will demand exactly this kind of structured, lifecycle-spanning traceability. The European product passport, already introduced for batteries and expected to apply to tires by 2027–2028, will facilitate traceability, with the Global Data Service Organization for Tires (GDSO) playing a key role in uniquely identifying products and providing comprehensive information through a tire information system. Organizations that invest in AI scanning infrastructure now will be far better positioned to meet these upcoming regulatory requirements and avoid potential non-compliance penalties when they arrive. 

Practical Implementation Across Different Tire Operations 

AI tire scanning is not a one-size-fits-all deployment. The right architecture depends on the operational context. 

Manufacturing plants benefit most from fixed industrial AI vision systems integrated directly into production lines. The priorities here are throughput, read reliability, and automatic integration with MES and ERP systems, so every scan creates a quality and compliance record without manual intervention. End-of-line inspection stations using AI-enhanced X-ray systems catch internal defects that surface cameras miss. 

Fleet operations and automotive service centers are well-served by AI-enhanced handheld or camera-based scanning tools. Smartphone-based AI tire inspection achieves 99.5% accuracy in detecting surface defects, including cracks, bulges, foreign particles, and dimensional inconsistencies making it practical for field teams to conduct compliant, documented inspections without specialized hardware. Cloud sync ensures records are captured and stored centrally regardless of connectivity conditions at the inspection site. 

Tire recycling facilities have specific needs around DOT code capture for manifest compliance. AI sidewall scanners that function reliably under dirty, damaged, or poorly lit conditions and that integrate with existing ERP or compliance platforms are the appropriate solution. Offline processing capability is important for facilities with intermittent connectivity. 

Across all of these contexts, the data integration layer matters as much as the scanning hardware. An AI scanning system that generates accurate reads but stores data in an isolated silo doesn’t solve the compliance problem. The value comes from connecting scan data to the broader quality management and compliance reporting workflow. 

The Strategic Case for Quality and Compliance Managers 

AI tire scanning is increasingly a competitive and regulatory necessity, not an optional upgrade. Manual inspection processes introduce error rates, compliance gaps, and audit risks that carry real financial consequences from recalled products to regulatory fines to the $100 million-plus annual cost of defective tires reaching market. 

The technology has matured significantly. Deep learning models trained on tens of thousands of real tire images now outperform human inspectors in terms of consistency and speed. Market adoption is accelerating, with self-learning AI systems for defect classification set to become the standard over the coming decade. And the regulatory environment driven by EPA digital tracking requirements, state agency mandates, and the upcoming EU tire product passport is moving firmly toward automated, auditable documentation. 

For compliance and quality managers, the question is shifting from whether AI tire scanning is worth evaluating to how quickly it can integrate into existing operations. 


Categories
Text Scanning

How AI Barcode Scanning Improves Solar Panel Traceability & Compliance

If you manage quality or compliance for a solar manufacturer or EPC firm, understanding the specific agencies enforcing regulations like UFLPA, ANSI/SEIA 101, and SSI standards helps you navigate the complex regulatory environment effectively. The Uyghur Forced Labor Prevention Act (UFLPA) has made supply chain documentation a key issue at customs checkpoints. The Solar Energy Industries Association’s newly ANSI-approved ANSI/SEIA 101 standard now provides a formal rubric requiring manufacturers and importers to trace product origins from raw materials to finished goods. And the Solar Stewardship Initiative’s Supply Chain Traceability Standard, published in December 2024, adds another layer of third-party accountability for silicon sourcing and for verification of production sites. 

What ties all of these requirements together? Reliable panel-level identification data is essential, and AI-powered barcode scanning offers a dependable solution that can strengthen your confidence in compliance and traceability efforts. 

 Why Manual Scanning and Paper Records Fall Short? 

For years, solar manufacturers have relied on manual data entry and handheld scanning with minimal software intelligence. The problem is well-documented. Manual data entry’s error rates of 1–4% can undermine trust; AI scanning significantly improves accuracy giving you peace of mind in your compliance records. Scale that across a utility installation of 50,000 panels, and you’re looking at potentially 500 to 2,000 incorrectly recorded serial numbers each one a gap in your compliance audit trail. 

The physical reality of solar panels makes this worse, not better. Engineers design the panels to withstand 25–30 years of UV exposure, thermal cycling, and moisture. Adhesive barcode labels, however, are not many become unreadable within 5–7 years of installation. When an auditor asks for a panel’s provenance record or a warranty claim arrives years down the line, degraded or missing scan data is a liability, not just an inconvenience. 

Manual processes also struggle to keep pace with the scale and speed of modern solar manufacturing. High-volume production lines require scan reads at production speed, with zero tolerance for missed reads or data gaps. A compliance manager relying on clipboards and spreadsheets is setting their organization up for audit failures before the first panel ships. 

What AI Brings to Barcode Scanning 

The leap from conventional barcode scanning to AI-enhanced scanning isn’t just about speed it’s about intelligence, reliability, and data integrity across the full panel lifecycle. 

AI-powered image recognition enables scanning systems to read degraded, partially obscured, or damaged codes that traditional laser scanners would fail to read. This process is critical for end-of-life compliance obligations (required by regulations in the EU, US, and Australia) where panels must be traceable even decades after manufacture. 

The fixed industrial AI scanners on production lines achieve read rates above 99.9% for DataMatrix, QR, and laser-etched serial codes when properly configured essentially eliminating the error margin that plagues manual entry. These systems are designed to integrate seamlessly with existing manufacturing execution systems (MES) and ERP platforms, ensuring that every scan creates an immutable, timestamped record that automatically feeds compliance documentation. Understanding this integration helps quality assurance professionals assess compatibility and implementation challenges. 

AI-enhanced handheld scanners, connected via Bluetooth to mobile platforms, enable field technicians to read codes under challenging conditions direct sunlight, awkward angles, surface wear and to sync that data in real time to cloud-based asset management systems. Even in low-connectivity remote solar farm environments, modern solutions cache scan data offline and sync automatically when reconnected, ensuring no record gaps. 

Drone-mounted AI vision systems represent the frontier for large ground-mounted installations, enabling aerial capture of serial numbers across entire arrays. This task would require days of manual walkthroughs compressed into hours, with computer vision handling the read-and-match logic automatically. 

Building an Audit-Ready Traceability Record 

From a compliance standpoint, it’s important not only to scan the panels but also to ensure that every scan generates a verifiable, structured data trail capable of withstanding regulatory scrutiny. 

ANSI/SEIA 101 specifically requires organizations to map the supply chain and collect traceability documentation for each component, down to the raw-material level. The standard also requires identification of high-risk suppliers and sub-tier materials. This task becomes tractable only when your panel-level records are clean and complete from day one of manufacturing. 

An AI barcode scanning for solar architecture supports this by: 

  • Linking serial numbers to supplier and batch data at the point of manufacture, so each panel carries a digital chain of custody from silicon sourcing through assembly 
  • Flagging anomalies in real time mismatched codes, duplicate scans, or unregistered serial numbers that could indicate quality issues or documentation problems before they become compliance failures 
  • Generating audit-ready exports that map directly to UFLPA documentation requirements or SSI traceability standard evidence packs 
  • Maintaining a timestamped history of every scan event, including who scanned, when, and from which device critical for demonstrating due diligence to customs authorities or third-party auditors 

 Defect Tracking: Traceability as a Quality Tool, Not Just a Compliance Box 

For quality managers, AI barcode scanning does double duty. The same serial number data that satisfies a compliance audit also powers root cause analysis and defect tracking. 

When a performance anomaly is detected whether through thermal drone inspection, string monitoring, or a field technician’s report an AI-linked serial number record lets you immediately pull the panel’s full manufacturing history: production batch, cell supplier, line station, inspection results, and installation date. This capability transforms reactive quality responses into proactive corrective action. 

If a batch of panels from a specific cell supplier starts showing early degradation, the traceability data lets you isolate exactly which panels are affected across your installed base, prioritize warranty claims, and notify downstream customers all without combing through disconnected spreadsheets or chasing down paper records. 

This kind of closed-loop quality intelligence is increasingly expected, not optional. Insurers of large solar portfolios are beginning to factor record quality and asset traceability into risk assessments. Developers and asset managers want documented evidence that the panels they’ve acquired have a clean, verifiable history. A robust AI scanning infrastructure positions your organization to credibly meet these expectations. 

Practical Considerations for Implementation 

Not every scanning solution is appropriate for every solar environment. A compliance manager evaluating AI barcode scanning should consider the following: 

Manufacturing plants equipped with industrial AI scanners integrate directly into conveyor and end-of-line test stations. The priority here is throughput, read reliability, and MES integration for automatic record creation. 

Field installation and O&M teams need AI-enhanced handheld solutions with offline capability and cloud sync. The software layer matters more than the hardware real-time data flow into your asset management system is what creates the compliance record. 

Large utility-scale assets may justify investment in drone-based AI vision scanning for periodic full-array audits, particularly where physical access to every panel is difficult or time-consuming. 

In all cases, the preference is for laser-etched codes on glass or aluminum frames over adhesive labels for long-term traceability, given the 25-year operational lifecycle of most panels. 

The Bottom Line for Compliance and Quality Teams 

The regulatory environment for solar is tightening, and standards like ANSI/SEIA 101 and the SSI Supply Chain Traceability Standard are setting a clear direction: documentation must be systematic, traceable, and defensible. Manual processes and disconnected records are no longer adequate to meet that bar. 

AI barcode scanning doesn’t just reduce error rates it creates the kind of structured, automated, panel-level data infrastructure that makes compliance achievable at scale and quality management genuinely proactive. For compliance and quality managers tasked with keeping their organizations audit-ready, it’s one of the highest-leverage operational investments available today. 


Categories
Text Scanning

Managing Large-Scale IT Asset Refresh: A Guide for ITAD Providers 

 The world’s IT asset disposition (ITAD) providers are about to experience a record number of retired endpoints. This situation has been building for over three years, and when the date of Microsoft’s official discontinuation of support for Windows 10 passed (October 2025), the tidal wave became reality. Now that we are in early 2026, the ITADs face a volume of retired endpoints for which they have no historical precedent to base their projections. The IDC and Gartner estimate that the number of devices running Windows 10 (that cannot upgrade to Windows 11) is between 240 million and 300 million worldwide (both corporations and consumers). The corporation has been managing those devices. These devices continue to sit in lease-return piles, in server rooms, waiting to be picked up, or in IT departments that failed tocomplete refresh projects before October 2025 and are now facing the same consequences! Reassuring clients about your capacity to handle this surge can build trust and reduce concerns about service reliability. 

  For ITAD providers, there is simultaneously the largest business opportunity the industry has ever had, as well as one of the greatest operational stress tests it will ever see. The provider that successfully navigates this will build long-term client relationships, expand its market share, and develop the infrastructure to prepare for the next decade. 

If handled poorly, an organisation can incur reputational damage, miss R2/e-Stewards audit cycles, and leave margin on the table. 

 The purpose of this guide is to help you properly handle your organisation’s assets. 

Looking at the Scope of the Work: Why This Refresh Cycle Will Be Different. Emphasizing surge volume management is crucial here, as it directly impacts operational planning and success. 

 It is nothing new for enterprises to refresh their hardware; they do so every 4 to 6 years. When that happens, however, the most important factor in determining the success of the new refresh cycle will be its simultaneous nature.  

Typically, during a refresh cycle, companies phase out their hardware based on lease terms and depreciation schedules. As an example, one of your major clients will phase out their equipment during the first quarter, while your other major client will phase out their equipment during the third quarter. Separating the refresh schedules will allow ITAD providers to complete their inventories before the next inventory cycle begins. 

There was no ability to stagger the phases of the refresh cycle that resulted from the Windows 10 end-of-life event. Microsoft released its schedule that everyone in IT and across every enterprise was aware of. As all of the IT departments were looking at the same schedule, and when all of them, for the most part, added purchases (when many of them purchased large quantities of devices in 2020 and 2021 to equip the workforce with remote devices) at the onset of the pandemic, and then trying to remove the devices at the end of the 12–18 months will create two waves of devices reaching the end of their service lives within that same window of time. 

Important Statistics:

Microsoft Windows 10 had about 1.4 billion users at its peak. Estimates suggest that between 240 million and 300 million commercial devices do not meet the TPM 2.0 or processor requirements for Windows 11, so they are too old to run it. Therefore, the number of devices that ITAD providers can capture, even within a compressed time period, is an extraordinary operational challenge. 

In addition to the sheer volume of these devices, other factors will compound the operational challenges faced by ITAD providers. The age of the devices will diminish their resale value. The devices being retired from Windows 10 were primarily purchased between 2016 and 2019, making them 7-9 years old. Even the devices that will still function properly will not have much market interest. Recognizing these challenges can help you plan effectively and feel supported in managing expectations, especially when a greater percentage of device volume will be allocated to recycling rather than remarketing. 

Client expectations have increased. Clients, particularly large enterprises that make up the majority of ITAD service buyers, have evolved as sophisticated buyers. Clients are now expecting real-time tracking portals to see where their retired assets are, certified data destruction with serialized certification, reporting that aligns with ESG requirements for sustainability, and accountability documentation for the chain of custody of assets throughout the downstream flow for audit purposes. Meeting client expectations at three times the volume will create unanticipated operational challenges.   

The regulatory burden has also increased, with the number of violations in recent audits highlighting the need for strict compliance. The R2v3 and e-Stewards standards have increased, and data destruction regulations at the state level have multiplied in the United States. 

The European Union’s WEEE regulations have undergone some changes in recent years. These changes will affect how ITAD providers operate as they process devices at surge volumes, ensuring compliance and completing all processing tasks simultaneously. 

Building The Operational Capacity To Handle Surge Volume  

ITAD providers need to be completely honest about the limitations of their existing processing capabilities—meaning they need to be aware of what they can actually process professionally. This adherence means they want to ensure they can process devices without compromising data security, the chain of custody documentation, or the quality of the processed devices. 

Logistics and Delivery 

Typically, the intake operations of ITAD providers experience their first increase in burden during peak volumes. Processing lines created to handle normal volume will find themselves blocked in processing lines when clients ship ten (10) times the number of devices to them, and the devices are arriving in shorter lead times. Therefore, providers must work to invest in several operational areas simultaneously to prepare for this type of surge. 

  • Full-scale Flexible Warehouse Capacity: Consider some form of partnership arrangement for short-term third-party warehousing before you experience the peaks, rather than during. Having a signed agreement with the partner before the surge allows you to absorb the surge without turning clients away or creating a backlog of devices at the time of receipt, thereby extending the time clients’ devices are exposed to security risks. Planning ahead can help you feel more in control during unpredictable surges.
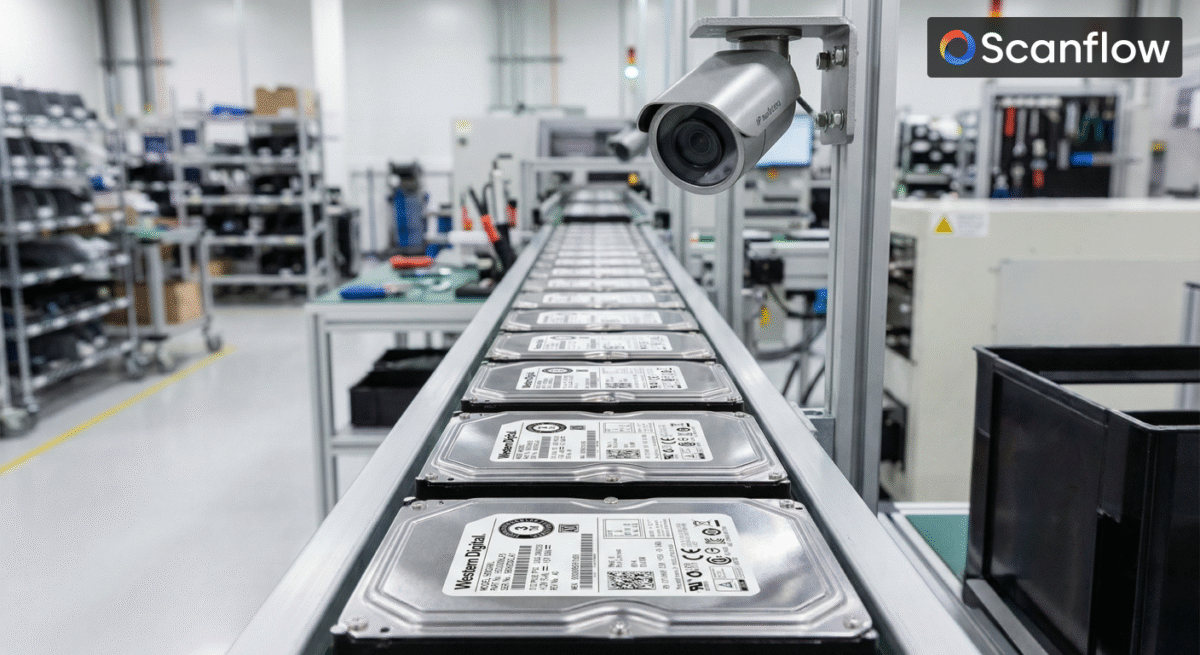
  • Make an investment in automation for intake processes: Utilise conveyor-fed scanner stations to automatically capture your assets, and implement a digital intake manifest that interfaces directly with your ITAM solution.    
  • Establishing dedicated client staging areas. Commingling devices from several clients during intake creates a chain-of-custody risk that can be closely scrutinised by auditors, as well as a challenge to maintain separation between devices as their volumes increase. Design your intake floor with client staging zones that are clearly defined and include measures to enforce separation through your tracking solution and not solely through physical space.    

Data Destruction at Scale 

Data destruction is the most important component of every ITAD engagement, and it is also where quality failures occur most frequently under high-volume pressure. It is essential to stress-test all aspects of your data destruction processes (overwriting throughput, degaussing capability, physical destruction rates, and certificate generation workflow) against your projected surge volume, not just at normal operating volumes.    

Key Consideration 

Many ITAD Providers do not account for the bottleneck in certificate generation. Certificates of data destruction must be serialised and tied to the individual asset record, verified by an unattended method of destruction, operator ID, and date/time of destruction. Manual certificate generation processes that are acceptable as part of normal business volume become severe bottlenecks as you attempt to provide certificates at 5x your normal business volume. Invest in automated certificate generation integrated with your ITAM system before an anticipated surge in work.  

For functional drives, the best practice is to continue using software-based overwriting as your most flexible option. 

Verify that your overwriting solution license validity supports concurrent sessions equal to your peak load. Document the overwrite standard used (e.g., NIST 800-88, DoD 5220.22-M, or as specified by client). Use automated reporting for drives that have failed overwriting, rather than relying on a technician’s judgment.   

Your physical destruction capacity should be adequate to accommodate all drives that have failed software overwriting, whether by shredding or crushing. On average, 8-15% of storage devices will fail or will be unable to be reused due to physical damage during a typical enterprise refresh cycle. Therefore, if your project has 100,000 devices, you should prepare physically destroy 10,000 to 15,000 drives. Know your shredder’s capacity, then factor it into your planning and schedule additional shredder capacity if required.   

Staff 

Staffing is where most companies (especially ITAD companies) experience their greatest “surge-failure” within their workflow. Certified data security technicians are not interchangeable with general warehouse staff (i.e., do not assume they can do the same tasks). They require training in data security, handling protocols for each device category, and the rules governing documentation for the certification of processes.   

Develop your staffing strategy around a tiered structure: a core group of fully certified data security technicians who perform data destruction and quality signoff, and trained ancillary staff to handle data intake, physical sorting, aesthetic grading, repackaging, logistics, and all other required tasks. This method enables you to effectively balance your labour-intensive workflow (for example, physically separating devices) while still upholding the certified processes associated with your enterprise. 

The High-Volume Issue of Data Security Compliance: Where Providers Screw Up   

Data security is a key client requirement for ITAD providers. Still, more importantly, it is an overall risk for any company that has the opportunity to cause a single data breach by not following procedures properly during an ITAD process. At high volumes, the risk of losing or having a gap in the transmitted data is much greater.   

Three Common Failures Related to Data Security Compliance at High Volume 

  •  Inadequate Chain of Custody for Devices while in Transit: When an employee of the logistics provider picks up a device from a company’s location, the Chain of Custody should be completed in real time, versus being reconstructed after the fact. Make sure to GPS-track, seal, and record the device container. Scan the electronic manifest at both pickup and delivery to the customer. Include liability for any breach of the chain of custody in the contract with the logistics provider.
  • Shortcomings Related to Overwrite Verification of Data: When the ITAD provider is processing a very high number of devices, it will be tempting to sample verify that overwrite has occurred versus each device. This method can put the ITAD provider at risk of noncompliance with the overall NIST and R2 requirements, and will constitute a breach of the customer’s contract and agreement. Verify that overwritten devices are automated, so the decision to complete overwrite is not left to human factors under pressure to meet high volume.
  • Vendor Qualification Failures Downstream: ITAD providers outsource the processing of devices they can process internally to third-party downstream vendors. 

The surge in volume impacts the downstream supply chain’s ability to deliver through compliance. Have you recently validated your downstream vendors’ certifications? Have you signed data security agreements with each of your downstream vendors? Does your auditor know the inclusion of your downstream vendors in your chain of custody? Missing any of this information could affect your ability to remain certified.   

Documenting Infrastructure 

To ensure a complete, accurate audit trail from intake to disposition, each device processed through your facility must have a date-stamped, tamper-proof audit trail. With the increased volume, the performance and reliability of your ITAM system and related documentation will need to be tested and validated for database performance, storage, and export capability based on your estimated peak surge volume; this includes the integrity of the auditable device(s) process through your facility. 

One simple thing many providers forget to do is inform their compliance teams and certifiers of their volume estimates before experiencing a surge in volume; therefore, your auditor needs to know in advance if you anticipate a tripling or quadrupling of your throughput so they can prepare to conduct an audit accordingly. Surprises during an audit can be unwelcome.   

Remarketing Old Devices 

The very uncomfortable commercial reality of the ITAD industry and the remarketing of whole units.  

An entry-level laptop manufactured in 2016 with an Intel Core i5 CPU and running Linux will attract low-end purchasers in developing regions. Still, it won’t be financially viable to sell to enterprise customers or general consumers who expect the latest technology. 

The devices with usable secondary markets are from Lenovo ThinkPad, Dell Latitude, HP EliteBook, and similar commercial brands, all made between 2018 and 2020. Aggressively pursue these. 

Diversification of Channels 

IT asset disposition (ITAD) companies that depend exclusively on one or two channels of remanufacturing/re-marketing to generate secondary-market revenue will find these channels saturate quickly as demand surges. Become proactive and diversify.   

  • Direct to Institution – Public school districts, non-profit organizations, libraries, governmental institutions, etc. often have access to grant funding or predetermined budgets which incentivize them to purchase working older equipment at discounted prices. Building these types of relationships takes time, so begin developing relationships today.
  • Export Markets – Secondary markets in Southeast Asia, Sub-Saharan Africa, Latin America, Eastern Europe, etc., absorb large volumes of older commercial-grade hardware. Verify that all export documentation, data erase verification, and audit trails are compliant with the import requirements of your target export market, and verify that all export compliance requirements for e-WASTE under paragraph 3 meet the European Union’s (EU) Basel Convention requirements.

 Recovering value from functional components such as RAMs, SSDs, CPUs, displays, and batteries can yield profit when companies cannot sell the device as-is. These parts harvesting activities will involve a significant investment in additional processing infrastructure, but the potential to improve blended recovery rates for older device cohorts can be substantial.    

Using online auction platforms, B2B IT equipment auction providers enable sellers to liquidate large volumes of similar IT assets to a broader buyer pool without developing and maintaining one-to-one relationships with each buyer. The efficiency of auction platforms is enhanced when selling similar IT assets with similar conditions and documented specifications.  

To achieve the best resale return on your IT assets, your organisation must consistently provide accurate cosmetic grading. If you undergrade your asset(s), you will realise lower recovery rates than you should for your asset(s). If you overgrade your asset(s), you will create buyer disputes, returns, and damage your reputation as a trusted asset seller. However, when dealing with the volume of IT assets typically traded in the current marketplace, it is very common for grading quality to suffer unless you implement specific measures.   

  • Consistent lighting at visual grading reference stations: Standardised lightbox stations greatly reduce the grading inconsistencies that result from the various forms of inconsistent lighting.  
  • Photographing all assets at the grading station: Taking photographs at the time of grading will create an electronic audit trail of each asset and provide documentation to help resolve buyer disputes and train new graders against your grading standards.
  • Periodically conducting inter-rater reliability assessments: Performing an inter-rater assessment in which two graders independently grade the same asset and then reconcile any discrepancies, in addition to tracking your graders’ grading consistency on your operational KPIs, will greatly help enhance the overall grading quality at your company.

Device Age vs. Remarketing Strategy: A Quick Reference 

Device Vintage Primary StrategyNotes
2020–2022Whole-unit resaleStrong secondary value, Windows 11 upgradeable in some cases
2018–2020Whole-unit resale/exportGood demand in secondary markets, parts value strong
2016–2018Export/parts harvestLimited primary market demand; strong parts value
Pre-2016Parts harvest/materialsFocus on component value recovery and responsible recycling
Damaged / non-functionalPhysical destruction/scrapCertified destruction + metals recovery

 Utilizing the Company’s Compliance to Customer Value Proposition through ESG Reporting and Sustainability 

The growth of sustainability reporting within companies has advanced very rapidly in the last three years. Corporate IT departments are increasingly required to report their environmental impacts from IT disposal processes to their CFOs and sustainability officers. Companies that can provide accurate, audit-ready ESG reports are winning contracts from those that cannot. 

What Enterprise Clients Need from ITAD Providers to Do Their Sustainability Reporting 

  • CO2 Equivalent Emission Savings From Device Reuse vs. Manufacturing a New Device
  • Tonnes of E-Waste Diverted From Landfill or Incineration
  • Verified Recycling Percentages by Material Type for Downstream Recycle Centers
  • Percentage of IT Devices Remarketed vs. Responsibly Recycled
  • Certification and Downstream Vendor Certifications Webpage
  • Social Value Metrics: Number of Devices Donated and Communities Served.  

If you cannot generate these metrics directly from your processing system, you are leaving significant value for your client on the table. Depending on how your client’s sustainability reporting obligations change over time, you could potentially lose your contract to another ITAD provider that can provide ESG metrics directly from its processing system.  

Opportunity: The largest ITAD refresh cycle in history is also the biggest opportunity for creating impactful ESG Impact Reports.  

For every device that is remarketed instead of repossessed or recycled, there is an associated CO2-avoidance benefit to the environment, as it avoids the need to manufacture a new device. You should quantify this for your clients’ reports and help them communicate it in their sustainability disclosures, as part of positioning your service as a sustainability enablement service (not just a compliance box). 

 Please set expectations with clients regarding communication during peak season. 

 A common and easily avoidable failure experienced by ITAD providers during high-volume periods is failure to communicate effectively with enterprise clients, sending out up to three times the number of devices. Since clients often do not realize they are putting pressure on your operations, the damage to the relationship caused by unmet SLAs, delayed certificates, or unresponsive account managers can persist longer than the spike in shipment volume. 

 As a best practice, ITAD providers should proactively inform clients of any capacity constraints and changes to lead times. If processing lead times are extending because of increased volume, you should proactively notify your top clients before they ask. Provide an estimated timeline for device processing and details on how you will manage the increase in volume. Clients who receive information from you proactively will build loyalty towards your services, while clients who feel surprised will look elsewhere. 

Visibility through Client Portal  

Real-time tracking portals have evolved from something that offered distinguishing features to an expected foundation offering for large enterprise customers. During volume periods, the value of client portal visibility becomes increasingly significant. Clients experiencing a real-time view of their device inventory’s movement through the processing phases reduce client anxiety regarding their compliance risks and mitigate their frequent status inquiries to your account team. 

 If your client portal does not have real-time device tracking, you should invest now to include that capability before the next surge, rather than as an after-the-fact recommendation.  

 Renegotiate SLAs  

If your normal processing impacts your timelines genuinely during your next peak volume period, you should renegotiate the SLAs with your enterprise clients before exceeding those timelines, rather than after. Most enterprise clients will generally accept extended timelines, but only if negotiations are carried out professionally and with plenty of advance notice. They will not accept an SLA that has exceeded, followed by retrospective explanations.  

Technology & Automation: Surviving the Surge 

Those ITAD providers who can navigate this refresh cycle effectively will not necessarily be the largest, but they will be the most automated. At higher surge volumes, manual processing methods, including paper- and spreadsheet-based processes, quickly become liabilities. 

By investing in IT asset management (ITAM) platforms, automated asset tracking, integrated data destruction verification, and digital certificate generation, businesses will be able to process more volume with fewer compliance errors and at lower per-unit costs. 

 Key Technology Investments to Achieve Scale 

  • Integration of ITAM Platform: The asset tracking solution must be able to manage the entire asset lifecycle from intake scanning to final disposition without requiring manual data entry at any stage of the process. Manual re-entry creates points in the process where there is a risk of error, as well as increasing the time it takes to complete the process. If you are utilising multiple, disconnected systems for intake processing, data destruction, and remarketing, the increase in volume associated with your IT asset management process will test the limitations of these systems and expose gaps.
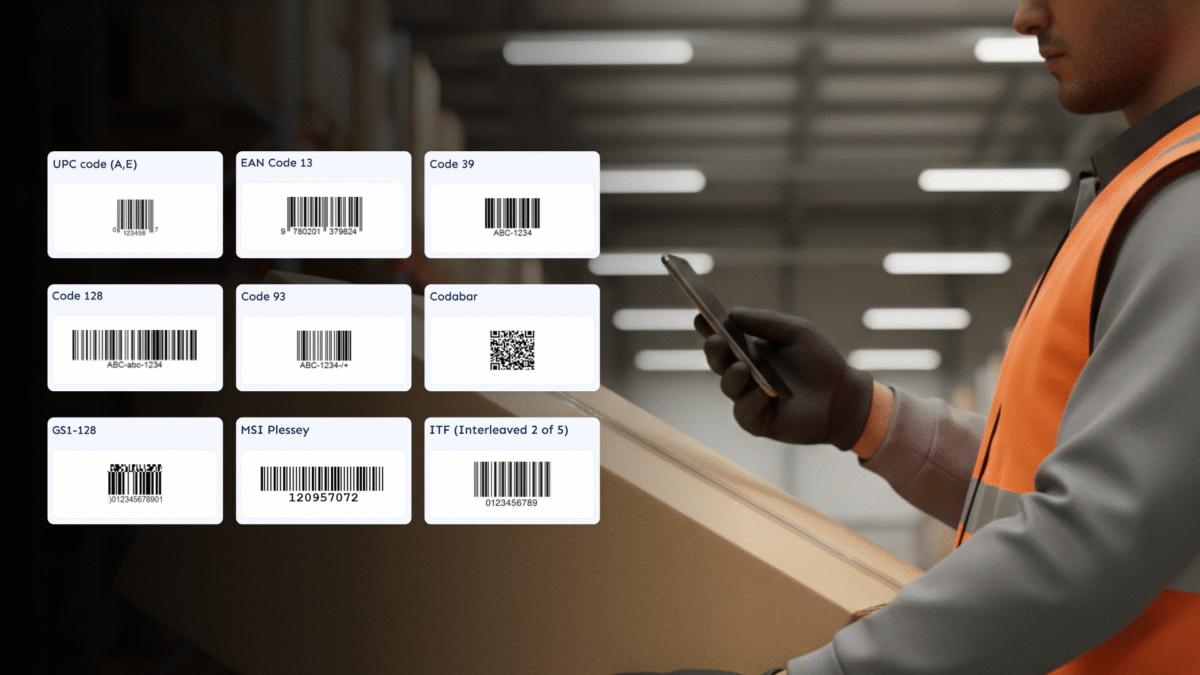
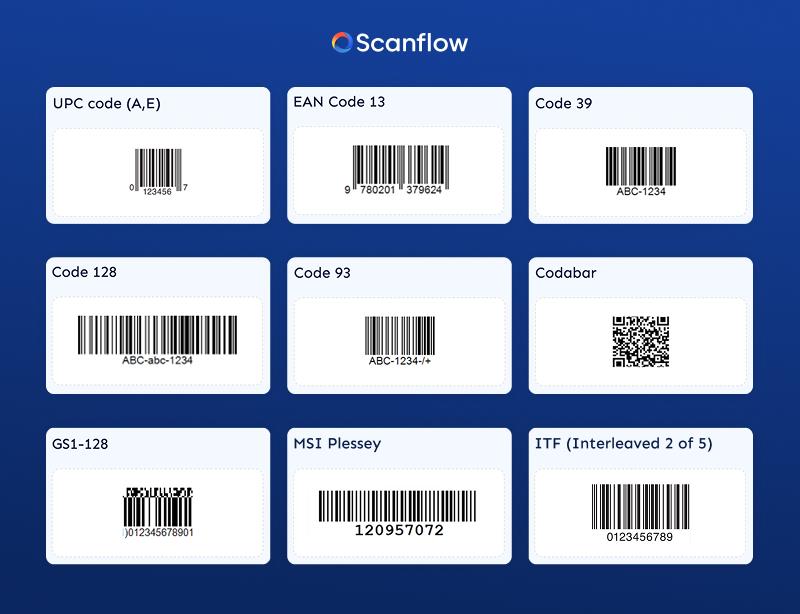
  • Automated RFID and Barcode Scanning: For every event in relation to Device Touch, there should be a timestamped record created in the system without requiring the technician to input this data into a spreadsheet manually. You should invest in an automatic scanning infrastructure.
  • Integrated Reporting of Data Destruction: Your data destruction solution needs to automatically provide the results of a data destruction process to your ITAM system without requiring any manual action; thus allowing the ITAM system to automatically generate draft certificates requiring only review and authorisation as opposed to having to create each certificate manually. As device volumes increase 10-fold, manual certificate creation will no longer be an option.

Client Portal Integration: An API that connects your client’s IT Asset Management (ITAM) or Computerised Maintenance Management Systems (CMMS) with your disposals platform enhances customer ease of use and provides a competitive edge through its functionality. Clients want to see their equipment in their ITAM or CMMS without having to reconcile the data manually; as such, they remain loyal to vendors that offer this integration. 

  • Automated Listings & Pricing: Devices listed for sale on remarketing channels are quicker to turn into cash when there is a system in place to pull device specifications from ITAM and push those specifications to the remarketing channel. During peak sales periods, an automated approach will help you turn your inventory quickly and efficiently.

Opportunities for Specialisation Events have provided a basis for all ITAD providers to develop specialisation opportunities, enabling them to offer customers a distinct competitive advantage that can endure over time.    

You can develop additional areas of expertise within your organisation and gain market share through these events. 

Sector Expertise: Healthcare, Banking & Finance, Legal, and Public Sector. Customers have specific device-disposal needs that exceed the average enterprise’s requirements. They include specific data shredding requirements, additional chain-of-custody procedures, and industry-specific compliance documentation. Specializing in one vertical allows you to secure long-term repeat business that cannot be easily commoditised. 

  • Management Refresh Programs: Instead of waiting for customers to contact you regarding device disposal, start offering managed refresh programs. You will track their devices’ ages, predict when they need to be collected, and schedule their disposal in coordination with their device purchasing cycle. This process will elevate your status from transactional vendor to strategic partner.
  • Data Destruction Consultation Services: Many enterprise-level IT departments are upgrading their data destruction policies and procedures as part of their refresh cycles. ITAD solution providers that provide consultative advice on data destruction procedures, policies & standards selection, and compliance documentation requirements will develop long-term relationships with their customers. 

Building Infrastructure for the Next Refresh Cycle   

The current refresh cycle will eventually come to an end. Those ITAD solution providers that invested in processing capabilities, technology, people, and customer relationships during this surge will look very different from those who just made it through. 

AI workstation upgrades, moving away from x86 architecture for enterprise computing, and eventually refreshing the devices that organizations are buying now and will replace their Windows 10 devices, will create volume peaks in the future. So don’t just focus on the present; build for the future as well.   

ITAD Surge Readiness Checklist   

This checklist will help you evaluate your organization’s readiness for large-scale ITAD operations: 

Operational ReadinessClient & Commercial Readiness
Intake capacity stress-tested against peak volume
Overflow warehouse agreements in place
Data destruction throughput validated
Certificate generation automated
Downstream vendor certifications are current
Staffing model documented and tiered
Chain-of-custody gap analysis completed
The client portal offers device-level live tracking
ESG reporting metrics generated automatically
SLAs reviewed and realistic for peak volume
Remarketing channels diversified
Grading standards documented and enforced
Account team capacity scaled for client comms
API integrations available for key clients

Conclusion

 The largest IT refresh cycle in history isn’t something that will happen in the future; it’s happening today, and there is still more to come. For ITAD vendors, the questions are whether the volume will arrive at your facility; whether your operational, technology, compliance, and client relationship capabilities are ready to meet the standards your clients expect and require certification. Those providers who approach this event with solid operational discipline, transparent communication to their clients, and strategic investment in automation will emerge from this surge with a stronger business than they entered. They would have improved their workflow through real-time experience, developed deeper client relationships that have enabled them to perform under high pressure, and created a foundation to turn a cyclical event into a sustainable competitive advantage. 

Trying to handle the increased volume the same way you have in the past will make it more challenging than you think to manage your ITAD (Information Technology Asset Disposition) operations. The quality issues that arise in ITAD are permanently damaging to the service and your relationship with customers — one incident of inadequate data security or a history of missing SLA (Service Level Agreement) times is enough to destroy years of establishing mutual trust.  

Categories
Solar

How to Automate Solar Panel Serial Number Scanning in Manufacturing & Installation

If you walk into a massive solar panel factory or a place where they’re putting solar panels on the utility grid, you’ll see technicians working on solar panel installations doing the same thing over and over again: Looking at each solar panel and using their hands to hold the solar panel up in front of them until they get to the correct position in the installation site; squinting at the small type on the solar panel; typing in the long code into a tablet or paper at the installation site. This is dreadfully slow, painfully inaccurate (mostly due to human error), and completely contrary to the speed with which the solar industry operatestoday. 

The global growth of the solar market is expected to be $300 billion by 2030, which means the demand for solar panel installations, tracking, and servicing will continue to grow rapidly. Therefore, the days when automation for solar panel serial number scanning was a luxury are gone. As a result, manufacturers, EPCs (engineering, procurement, and construction), and O&M (operation and maintenance) companies need to implement solar panel serial number scanning in an automated fashion to maintain their competitive advantage.

The guide is focused on serial number tracking of solar panels; the following information should provide you with a good understanding of what you need to know: why solar panel serial number tracking is necessary, where manual processes will fail, what types of technology work best in solar panel environments, and how you can create an end-to-end, automated, field-tested process for scanning and tracking solar panel serial numbers. 

Managing a utility-scale project comprising tens of thousands of solar panels from various manufacturers makes it a daunting task to manage accurate and up-to-date data.  

The following describes the consequences of mistakes made while tracking serial numbers:  

  • Denial of warranty claims. Because there is no verification of the installation record against the serial number, manufacturers will frequently deny warranty claims. Repairs of one defective solar panel that is disputed warranty data will cost the repair company more in administrative time than the original repair. 
  • Product recalls are exceedingly challenging to execute. When manufacturers issue recalls for defective products, it is difficult for solar sites with no records of the serial number to identify affected solar panels among many sites across the country. 
  • Increased compliance risk. The EU, US, and AU all have regulations in place that require compliance with recycling and end of life obligations on a solar panels and require traceable records to the solar panels that you own. Commonly, records that are kept manually will not hold up to an audit. 
  • Reduced operational efficiency for owners and operators. Many Solar providers provide their fleet operators access to view historical records (including the installation date, inverter association, cleaning schedule, and past performance of solar panels), that allows their field technicians to have everything that they need to work efficiently in just a few clicks on the computer. 
  • Increased insurance claim costs. Insurers of large portfolios of solar energy are beginning to take into consideration how well their assets are being managed by comparing quality of records of how their investments are being tracked through the use of serial number traceability and whether or not there are any issues that could cause an insurance claim. 

Where Manual Serial Number Scans Are Not Successful

The pace of manual serial number input, or even one-by-one scanning via a handheld unit, is slow. This can result in failure on multiple levels as time passes. 

Errors in Data Entry  

Studies on manual data entry, primarily in manufacturing, show an error rate from 1–4%. For instance, assuming the installation of 50,000 panels, this would result in an estimated 500–2,000 serial numbers being recorded incorrectly creating potential problems with warranties, compliance and/or maintenance.   

Degradation of Barcodes in the Field  

Solar panels are built to last 25–30 years and are subjected to UV, thermal cycling, moisture and physical wear and tear this all shows up as degradation of printed barcodes or QR codes on the labels of the panel. Laser etched codes on the glass or aluminum frames will last much longer than the adhesive labels that many of the older panels use and the adhesive labels are typically no longer readable past 5-7 years after being installed.   

Bottleneck in Workflow  

Larger utility scale installations generally have the scanning group working independently of the installation. If the scanning group has scheduling overlaps, the slower-running scannings can cause delays to the entire project, if they are too far behind, there is great temptation for the teams to skip records or perform batch recording based on the delivery manifests thus compromising the panel level accuracy completely.  

Data Silos Between Manufacturing and Field  

Manufacturers record serial numbers with their internal ERP systems. 

Contractors generally log their work into their construction management software. Owners and operators often utilize different systems than the contractors they hired. When these systems are disconnected, the same serial number for a solar panel is entered multiple times by various people and creates multiple opportunities for error and inconsistency. 

Solar Serial Number Scanning Solutions: What Is Effective  

One solar panel serial number scanning solution may not be as ideal as others because the solar environment is challenging for different types of barcode scanning. Below is a comparison of the different serial number scanning solutions: 

1. Fixed Industrial Barcode Scanners (Manufacturing Plants)  

Fixed-mounted laser or imager scanners mounted on conveyor lines or end-of-line test stations at a manufacturing plant. They can read 1D barcodes, DataMatrix codes, QR codes, and laser-etched marks at production speeds without any manual intervention.  

Recommended For: 

High-volume solar panel production operations using a fixed point. They typically have a read rate greater than 99.9% when they are lined up properly and maintained correctly. 

2. Handheld Bluetooth Barcode Scanners  

Handheld Bluetooth barcode scanners connected to tablets or cellular phones are the primary option for installing and commissioning solar panels in the field. When used properly, the new generation Bluetooth handheld barcode scanners can read 1D barcodes, QR codes, and DataMatrix codes with limited restrictions in direct sunlight. The most important difference in handheld Bluetooth barcode scanners is the software.  

Commodity hardware is used for the scanner; the critical component of scanned asset data flowing into your asset management system in real-time. 

 Best suited for: 

Panel-level audits or fault finding for O&M teams in small to medium-sized installations should be considered; low upfront cost and flexibility for operational workflow integration.

3. Drone Aerial Scanning

Using drone-mounted camera systems with computer vision capabilities enables off-site scanning of panel serial numbers or asset tags across an entire array. Using drone aerial scanning is most efficient for large ground-mounted installations because ground walking through every row would be very time-consuming. The current scanning systems right now can achieve a read rate of 85%-95% against a good label condition. Therefore, scanned codes that are degraded due to soil or shading require manual verification. 

  Emerging Technology: Rapidly maturing, drone scanning is currently in use by numerous large Independent Power Producers (IPP) and asset managers for their annual portfolio inventory audits. By years end, you can expect scanning systems to demonstrate significant improvements with read rates and cost performance.

4. RFID Tracking of Panels

Several large panel manufacturers and large solar developers are beginning to utilize RFID tags either attached or embedded into the frames of the panels. RFID technology does not require direct line of sight, can be scanned even under moderate soiled panels, and many panels can be scanned simultaneously with batch scanning techniques. Cons of RFID technology are the higher price you pay for each panel and the expense associated with building the required reader infrastructure to use RFID tag technology. 

5. Next Generation Computer Vision + AI 

The development of computer vision systems that can be utilized in the field to recognize solar panels using images has matured from a research study to a commercial deployment activity. These computer vision systems will be installed in various locations and will use a camera technology already available (e.g., standard cameras mounted to tracker rows, drones, or maintenance vehicles) to provide asset management platforms with recognised identifiers associated to the associated panel image. 

TechnologyBest EnvironmentTypical Read Rate
Fixed industrial scannerManufacturing / factory>99.9%
Handheld Bluetooth scannerField installation / O&M97–99%
Drone + computer visionLarge ground-mount arrays85–95%
RFID readerAny (no line-of-sight)95–99%
AI computer vision (OCR)Arrays, trackers, drones88–97% (maturing)

 Automation of the Solar Panel Scanning Process 

While scanning hardware is an important piece of this puzzle, automation requires the development of a connected workflow to allow scanned data to be transferred directly from the field to systems that require the data without any human intervention. 

Step 1: Establish a Canonical Serial Number Standard 

Before implementing a new scanning solution, it is critical to establish a definitive standard for the serial number used for each panel. Although this may seem like an obvious step, many organisations either have multiple incomplete databases that contradict each other or have no established standard. Therefore, it is important to clearly define the following items: 

  • Master Record from whence the data originates (usually the asset management system, or CMMS)
    •    How manufacturer serial numbers correspond to the company’s internal asset number if it exists
    •    Any additional data captured at scan time, including GPS coordinates, installer ID, string assignment, image of the panel at the time it was installed, and time of image captured. 

Step 2: Choose Your Integration Architecture 

Your scanning system should connect to the databases of your backend platforms through APIs that are using Basic Authentication, most newer asset management systems (Salesforce, SAP PM, IBM Maximo, Infor EAM, SolarEdge or O&M systems) will have Web API’s (REST) available that can receive serialized asset record data The questions you need to ask to get started are:  

– Will scanned data be synced in real time (i.e., as it is scanned) or in batch (i.e., after a technician has finished their shift)? 

– What happens if the technician is scanning from a remote location and there is no internet connectivity? (The answer is to build an offline-first mobile application that queues scans and syncs them later) 

– How will your system validate serial numbers against the manufacturer’s product database (i.e., to catch errors right away) when a technician scans a serial number?  

Step 3: Use Real-time Data Validation 

The biggest benefit of an automated scanning database versus a manual database is being able to validate the data that is scanned as soon as it is scanned. When a technician scans the serial number of a panel, its validation will be:   

– Is this serial number in the manufacturer’s product database? (If you have an API integration or have uploaded the manufacturer’s product manifest) 

– Has this serial number already been scanned and logged at another site? (Working with criminals and catching them in the act) 

– Does the spec of this panel match the expectation for this position in the string (example: wattage, voltage class, cell technology)?   

Step 4: Record Commissioning Data 

Initiate the capture of a complete commissioning record, rather than just the serial number, using the scanning event you just completed. A mobile scanning program should prompt the installer to verify that the following items were performed:  

  • GPS location of the installation or manual row/string location of the installation (for structured installations) 
  • Inverter/string assignments 
  • Completion of initial visual inspection 
  • Photographic documentation of the front of the label and location of installation 
  • Installer certification and signature.

Step 5: Close the Loop with the Manufacturer’s and Warranty System 

The most sustainable use of automation is when the serial number documentation can be automatically sent back to the manufacturer/insurer. Work with your panel suppliers to develop the following:  

  • Automatic warranty registration via API at the time of commissioning scan 
  • Batch exports of serial number confirmation per manufacturer’s required format 
  • Recall notification triggers to immediately identify impacted assets within your portfolio.

Panel Label Durability-Field Perspective  

A poor scanning process prevents the code on the panel from being scanned. Label durability is often overlooked when discussing solar asset management; therefore, it should be considered when selecting the panels and maintaining existing fleets of panels.   

What Deteriorates Labels  

  • Adhesive labels are very vulnerable to UV rays; laminated polyester labels can endure longer periods of UV rays.
  • Temperature changes cause the edges of labels to curl, and the labels themselves to crack due to thermal movement.
  • The chemical attacks on labels occur from a variety of sources such as cleaning products, bird droppings, and pollutants.
  • Physical wear and tear causes damage to labels through mechanical means such as the use of cleaning tools, hailball impact or when panels move on tracking systems.  

Better Options:  

  • Laser etched codes on aluminium frames are very durable and will not fail as they do not use any adhesive material, thus lasting the entire life of the solar module.
  • Ceramic Ink printed code on the glass back of a solar module is resistant to ultraviolet light and chemical attacks, and is less susceptible to abrasion than the frame mounted labels.
  • RFID tags in the junction box are not exposed to environmental elements and can be scanned without a line of site.  

Pro Tip:  

If you are performing an audit on an existing fleet of solar modules with degraded labels, plan to relabel when you next perform scheduled maintenance rather than accepting gaps in read results. A lost serial number during warranty disputes between manufacturers can cost significantly more than a relabeling program.   

The ROI Case for the Automation of Solar Serial Number Scanning 

Developing the business case for automating serial number scanning becomes evident when calculating the real cost of not automating it.  Here’s an outline of how to calculate your return on investment.  

Decrease in Labour Cost  

Approximately 45–90 minutes of the labour required to scan and enter the data for 100 panels is used up to complete an installation that has been performed to industry standards. 

The amount of time that is required for automated scanning with real-time integration and reporting has been reduced from previously up to 90 minutes per 100 panels to only 10-15 minutes. This corresponds to an approximate saving of 150 hours of person time on a 10 MW project consisting of approximately 25,000 panels, when calculated using the average commercial electrician or specialty commissioning rates. This also means that there will be significant dollar savings before accounting for the costs of correcting errors.  

Verified Warranty Recovery 

Solar operators that utilize automated scanning and have the ability to track serial numbers and provide prior to installation commissioning documentation as part of the warranty recovery process have reported significantly improved warranty claim acceptance rates. Some have reported increases in acceptance from 60-70% to 90%+ when validation with time and GPS stamps is able to be provided as part of the warranty recovery process. The difference in warranty recovery between utilization of verification and not will be in the hundreds of thousands of dollars over the panel warranty period for large portfolios. 

Starting the Implementation Process – Getting Started   

Below are some relevant steps that you can take to start the automation of your solar panel scanning program of serial numbers:   

  • Audit the quality of your current serial number data (what your current quality is will help guide you in the deployment of new systems) 
  • Mapping of the serial number data flow from manufacturing, through delivery to installation, commissioning, and continuous data capture
  • Choose suitable scanning devices based on how you will be primarily using the devices (i.e. assembly line, installation in the field, and/or periodic inspecting). 
  • Test mobile scanning applications that can function while offline with an API connection to your asset management software. 
  • Obtain access to manufacture’s API for product validation or to obtain structured data export files for validation use. 
  • Run a pilot project or use a pilot location, the results will be used as a benchmark for your overall project success, including; read/scan rates, error rates, and man-hour rates. 
  • Establish label quality criteria to be used for new panel procurement. 
  • Plan a re-labeling program for all your existing fleet that have degraded bar coding. 
  • Teach your field installers on how to properly perform scanning activities based on how they are trained to use that equipment. 
  • Define key performance indicators, target read/scan rate of +99%; target error rate of <0.1%, target commissioning complete at time of new inventory. 

Common Pitfalls: 

  1. Treating scanning as an IT project instead of an operations project. If the installer or technician does not perform work correctly, then the system will not work. The scanning process must be considered in conjunction with installers and technicians so that it can be optimised for their operations. 
  2. Underestimating the need for offline scanning capabilities. Remote solar sites often do not have good or consistent mobile network connectivity. Therefore, when selecting a mobile scanning solution, it is important that it has the capability of providing offline scanning capabilities seamlessly (i.e. queuing the records to be sync’d once the system is back “online”). 
  3. Disassociating the panel manufacturers’ relationship to the data. The effectiveness of your scanning system is only as strong as your supplier’s ability to provide you with accuracy. Therefore, it is very important to work to develop those relationships early. 

Maximizing for scan speeds instead of scanning quality will result in a slower scan at a rate to capture the GPS position, photograph, and string assignment, for this data will provide a much larger total value over an asset’s expected usable life of 25 years. As compared to the value provided through a single scan of only a serial number, the slower scan will produce far more value. 

A failure to have a plan that addresses degradation on existing labels in the fleet will become necessary for asset owners to have a remediation plan to keep the fleet operational using automated scanning methods. All operators will be needing the work needed to remediate existing assets that use degraded labels in order to move forward with the automated scanning technologies.   

As the way forward becomes clear, the expansion of the solar energy sector and the increased complexity of the product offering through a combination of increasing the number of solar technology installations with the expansion of portfolios will be dependent on the development of a digital identity for every solar panel. Digital identities will enable:   

  • analytics related to performance,
  • predictive maintenance,
  • warranty management,
  • recycling compliance, and
  • secondary market transactions.  

The movement toward solar panel Digital Identities is being rapidly accelerated by:   

  • The introduction of EU Battery and Solar Regulations; and
  • The Digital Product Passport initiative of the European Commission. Both the regulations and the initiative will mandate that every solar panel is issued with machine-readable identifiers and a direct link to lifecycle documentation.

Provenance tracking based on blockchain technology: An increasing number of manufacturers and industry consortia are now implementing pilot programs utilizing blockchain technology to generate immutable, shared records of a panel’s identity and historical data that can be accessed by all participants in the value chain.    

 First, using Artificial Intelligence (AI)-powered anomaly detection, asset management platforms are now applying panel-level serial number data in conjunction with performance monitoring to identifyindividual panels that are beginning to exhibit early signs of degradation, allowing operators to proactively implement targeted maintenance prior to equipment failures.    

In summary:

Automating the scanning of serial numbers associated with solar panels creates significant enhancements throughout their life cycles by enabling the growth of faster and more accuratecommissioning, streamlining warranty management, improving operational and maintenance services (O&M), and ultimately meeting recycling compliance standards. In addition, the technology necessary to improve upon solar asset management processes is both mature and accessible. The major issue that exists is developing an effective integration strategy for incorporating the technology into cohesive workflows, while also maintaining the data integrity required for long-term use.  

The solar industry is experiencing an inflection point. Projects continue to increase in size with respect to the number of solar panels required (which in turn contributes to overall cost), but also continue to provide less profit margin than they have in the past. Therefore, those operators or manufacturers who establish an automated, robust system of data collection for solar asset management will have a competitive edge as the solar market continues to mature; not only with respect to increased operational efficiency but also with respect to providing greater financial returns than ever before to both their investors and customers. 

It’s important to make an immediate transition from using manual scans and spreadsheets for record keeping to something more advanced like an automated solution, otherwise you may experience disputes on your first warranty claim once the project is completed.
 

Categories
Tire Sidewall

Mobile vs Fixed Camera Systems: Which Is Better for Tire Serial Number Scanning

Technical problems are not to blame for the failure of tire serial number scans to get recorded. The primary reason is because the criteria used for scanning do not correlate to the true physical movement of the tire during the operational process. 

  When scanning cardboard boxes or retail products, we expect consistency in time at which the products will be scanned. However, when we scan tires there is no such predictability because tires will be scanned at various times during the process from off-loading to stacking, to redistribution, to returns, and even to scrapping. Additionally, if we look at how the serial number is printed, it may be stamped into the tire, wrapped around a curved sidewall, or worn after it has been scanned from inside the tire. All these factors make the decision of using mobile scanners or a fixed camera system a much more strategic decision than may first appear.  

In order to build a solid and reliable tire traceability system, we must first understand how the two different approaches perform in the real world.  

How Tire Serial Number Scanning Really Works  

People have a tendency to think of scanning as the scanning of flat labels or printed codes. This is evidenced by the large number of search requests related to how to scan a barcode, how to scan a barcode using an iPhone, etc. However, tire serial number scanning has a very different set of realities.  

Rather than reading high contrast printed bars, systems need to actually interpret low contrast embossed characters on rubber. When reading a barcode with a camera, it is necessary for the camera to compensate for the curvature of the tire, shadows that cover part of the barcode, dirt on the barcode, and the inconsistent lighting conditions. Many generic barcode solutions fail at this critical point.   

The mobile scanner and fixed camera systems were both designed to resolve this issue but utilize completely different techniques to do so. 

 Mobile Scanners in Tire Operations 

Mobile Scanners Generally Operate Using a Smart Phone or Rugged Hand-held Device Which Runs a Mobile Scanner Application. The Camera on These Devices Utilizes the Camera to Capture an Image of aTire’s Side Wall to Provide a Software Program with the Information It Needs to Extract the Tire’s Serial Number. 

 The need to use mobile scanners in tire workflows is significant because tires are not usually in a controlled position. Mobile scanners are used by warehouse staff members for barcode scanning in receiving and dispatching deliveries of tires. Retailers utilize mobile barcode scanning equipment for performing inbound inspections and validating warranties. The teams performing scrap and recycling activities also use mobile bar-code scanners because of dramatic differences in orientation and condition of tires. 

Mobile scanners for tire applications are generally not the same as consumer grade tools used for packaging retail items. Mobile scanners are adapted to handle distorted angles and damaged surfaces. That is why many simple mobile barcode scanner applications do not provide acceptable results without being backed by advanced visual intelligence. 

Strengths and Limitations of Mobile Scanning 

The major strength of mobile scanning is the ability of a mobile scanner to go to the tire, versus having to move the tire to a mobile scanner for scanning the barcode, which make it an ideal application for tire aftermarket distribution and reverse logistics. 

However, mobile scanning also requires the user to be trained. Factors such as angle, distance and stability in scanning will affect the quality of results. If no intelligent guidance and validation are provided during scanning operations, the chances for increased error rates will increase. 

The information technology known as throughput is limited in that mobile scanning is only capable of working with one tire at a time; therefore mobile scanning will not work on high speed production lines. 

A case can be made for mobile scanning flexibility instead of moving large quantities of items.   

Fixed Camera Systems for Tire Serial Number Scanning 

Fixed camera systems have been designed differently than mobile scanners. The cameras are mounted at set points along the conveyor or inspection(s), where they can be placed in a predictable place along the path(s) of the tires as they pass.    

In a well-controlled manufacturing environment, fixed cameras can run flawlessly. Having known light levels, directions and consistent motion will give the camera the ability to take a scanned picture of the serial number continuously and at speed. In fact, many operations will first purchase barcode scanners to establish points on a PC camera for future set-up to create a stable location when converting to industrial cameras.  

Fixed cameras are ideal for production lines as they can eliminate personnel variability and provide a very high throughput.    

Where Fixed Camera Systems Fall Short   

The main advantage of fixed systems (consistency) also is the main disadvantage of fixed systems. In many instances printing on a tire will be out of orientation – meaning that the serial number printed on the tire may have rotated away from the fixed position to which it was installed.  

When a tire rotates unexpectedly, if the serial number rotates and is facing inward or if a tire has a piece of debris on the side wall, the fixed camera will not see the printed serial number. In addition, unlike a mobile scanner app, the fixed camera cannot reposition (i.e., not adjust angle or height to try and scan the first time missed) to get another chance to see the printed serial number on the side wall due to having no other places to mount an additional camera.  

The costs associated with this technology will rise quickly due to the costs of equipment to install, calibrate, control the lighting of and maintain a stationary system. As such, stationary systems are not widely deployed in places like warehouses, retail stores, and scrap yards where control zones are not available.   

The “Hidden Camera Scanner” Misconception   

When searching for a hidden camera scanner, users often display their frustration over not finding an actual solution. There is no type of hidden or passive system that can accurately scan a tire serial number unless there is a clear line of vision to that serial number.   

While you can use a fixed or mobile scanner to acquire a usable image of the serial number, the difference is not invisibility but rather the adaptability of either system. 

How Tire Businesses Actually Scan in Practice 

In a typical real-world operation, most businesses do not use just one method of scanning. 

Manufacturing will primarily rely on stationary cameras for their speed of scanning. Warehousing and retail will primarily rely on their flexibility through mobile workflows that utilize barcode scanners. Exceptions, audits, and failures will be scanned with mobile scanners inside of manufacturing facilities.  

The Hybrid Reality Is Present Regardless of Intent. 

 So, What’s the Conclusion?  

 There is no right answer for everyone.  

Mobile scanning excels at tracking tires in areas of unpredictability. Fixed camera systems perform well in controlled environments. The highest risk occurs when a traceability system is designed, assuming everything will operate perfectly.  

The best strategies for tire serial number scanning are based on coverage rather than the hardware used. Each scanning method provides a back-up to other methods of scanning and ensures that each type of scanned serial number maintains the same level of traceability.  

This is how scanning systems differ from traceability systems. 


Categories
Tire Sidewall

Common Challenges in Tire DOT Code Scanning and How AI Solves Them

Scanning DOT codes is a critical part of the tire industry because accurate data collection ensures traceability, supports recalls, and maintains compliance, directly affecting operational efficiency and regulatory confidence. 

Despite being one of the most common areas for error in the tire manufacturing process (as well as in warehousing, distribution, and tire scrapping), scanning DOT codes continues to exhibit high levels of inaccuracy. Emphasizing accuracy can make the audience feel reassured about AI’s potential to improve reliability. 

 Why is it So Difficult to Scan Tire DOT Codes?  

DOT codes are not attached with a sticker or printed on a label. Instead, they are embossed directly onto the tire sidewall. The position of the code varies significantly from one tire to the next; some tires may not show the full code on either side, and how the DOT code is positioned affects its visibility, depending on the tire’s construction. Factories, supply yards, and warehouses typically do not properly position tires to improve scanning accuracy.  

As time goes by, the problem worsens due to environmental factors like dust, rubber, insufficient light, and surface weathering, making it difficult to read the code clearly with a regular scanner or basic OCR software. Recognizing these challenges can help the audience feel understood and open to innovative solutions like AI. 

There’s risk in manually entering DOT codes, as a single typographical error could impede traceability, jeopardize recall reliability, and create issues during compliance audits. As organizations grow and scale, these types of errors will remain hidden until a recall, a warranty claim, or another regulatory inspection reveals data inconsistencies. 

Why Traditional Scanner Tools Are Falling Short 

In traditional scanners, users applied fixed rules for scanning DOT codes under ideal conditions. This process typically involves having clearly legible characters directly facing the scanner camera and consistent lighting conditions. However, these ideal conditions are rarely present in most tire operations during DOT code scanning. Non-compliance with these conditions can make scanning tedious or cause it to fail altogether. 

In high-speed environments such as tire manufacturing lines and truck stop dispatch lanes, there is significant pressure to maintain production speed. While scanning in these environments, there is little or no consistency in code scanning, which is either missed altogether or scanned at random intervals, thus creating inconsistent data across multiple systems. 

 How AI Scanning for DOT Codes Changes the Game 

AI-based scanning uses computer vision to recognize DOT codes on tire sidewalls, even when partially visible or obscured, significantly improving accuracy in challenging conditions. 

For example, platforms such as Scanflow first determine the location of the DOT code region, then extract and validate the code characters in real time. 

In both scrap and EPR workflows, capturing accurate DOT data is essential to prevent illegal sales of scrapped/non-compliant tires. AI-based visual capture capabilities enable scrapped tires to be properly identified, documented, and tracked through disposal/recycling processes, thereby supporting compliance with EPR regulations and improving audit transparency. 

 From Automated Scanning to Full Traceability   

Automated and reliable scanning of DOT codes adds value well beyond compliance. Clean, consistent data from DOT codes improves inventory rotation, enhances the precision of recall execution, and increases coordination among production, logistics, and aftermarket teams. Highlighting operational benefits can make the audience feel optimistic about AI’s impact. 

AI turns DOT scanning from a manual job or compliance checkbox into an ongoing source of operational intelligence. Scanflow provides a way to incorporate DOT scanning into the existing process without specialized equipment, enabling organizations to expand their ability to capture DOT codes across multiple locations. 

In Summary 

Physical constraints and outdated technology have historically limited the use of tire DOT code scanning. However, with stricter regulations and increasingly complex supply chains, these limitations now pose a significantly higher risk. 

AI technology enhances DOT code scanning by improving accuracy, reducing manual labor, and increasing traceability throughout the tire lifecycle. For tire manufacturers, distributors, and aftermarket participants, adopting AI is not just about innovation; it is essential to building resilient, compliant businesses in the future. 

Categories
Barcode scanning

Types of Barcodes: Choosing the Right Barcode

Barcodes are integral for tracking items and providing identification in today’s world.

Barcodes allow an organization to quickly, accurately, and automatically capture data at retail store checkout, warehouse shelves, hospitals, and manufacturing operations. 

However, choosing the correct barcode can prevent scanning failures, regulatory issues, and operational delays, helping you feel confident in your decisions. This guide aims to support you in making informed, reliable choices for your company’s needs. 

 Differences between 1D and 2D Barcodes 

(Linear and Matrix Barcodes) 

Types of Barcode

In most cases, we can classify barcodes into two types: one-dimensional (1D) and two-dimensional (2D). 

1D BARCODES VS  2D BARCODES 

Feature1D Barcodes2D Barcodes
Data storageLimited (numbers/characters)High (text, URLs, IDs, metadata)
StructureHorizontal linesSquare or rectangular patterns
Scan directionSingle directionMultiple directions
Error correctionMinimalStrong built-in error correction
Space efficiencyRequires more widthStores more data in less space
Common useRetail, logisticsManufacturing, healthcare, mobile

Barcode Types and Commonly Used Barcodes  

Different industries use specific barcode types, and choosing the right standard directly affects scan accuracy, system integration, and scalability. 

One-dimensional (commonly referred to as 1D) barcodes (linear barcodes) have been the predominant barcode standard for many decades, typically found in retail, packaging, and logistics. 1D barcodes allow businesses to quickly and reliably identify products. The UPC is the most widely used 1D barcode in North America, while the EAN is the most commonly used standard internationally; both continue to serve as the underlying foundation of retail point-of-sale and inventory control systems. 

 Growing demand for rich data and flexible barcode scanners is pushing the market toward adopting 2D barcodes, which store more data in less space and are camera-readable. 

 This trend is occurring worldwide. Retail and manufacturing ecosystems are preparing to migrate from a world of 1D barcodes to hybrid 1D and 2D barcodes (i.e., QR Codes and Data Matrices) on packages. Instead of eliminating all 1D barcode usage, many organizations are pursuing hybrid strategies that will enable organizations to continue using existing infrastructure while moving towards future-proof capabilities. 

Curious about how many kinds of barcodes there are?


 Exploring this can inspire confidence in your ability to select the best options for your operations.  

While there are approximately 30 barcode symbologies in use today, only a handful still exist. We focus on the 13 primary types of barcodes used in retail, logistics, manufacturing, healthcare, and transportation industries. 

 One-Dimensional (1D) Barcode Types 

 1. UPC Barcode 

 UPC Barcodes are primarily used in North America (the United States) to identify and scan consumer items via point of sale. They provide quick, easy checkouts while still allowing a unique identifier for each item within a given retail system. 

The most common UPC format is UPC-A. This barcode type is a 12-digit number that uses the same encoding system as EAN-13, with the only major difference being that UPC-A omits the leading zero used in North America. 

When packaged products are smaller than traditional packaging, retailers use the UPC-E type. UPC-E is a compressed format that contains 6 digits and interfaces well with standard UPC systems. 

In addition to their use at the point of sale, UPC barcodes play an important role in retail inventory management by enabling accurate tracking from the manufacturer to the warehouse, from the warehouse to the distribution center, from the distribution center to the store, and finally from the store to the customer. 

 UPC Barcode Features: 

  • Data Capacity: Global Trade Identification Number (GTIN) with a Capacity of 12 Digits for UPC-A and 12 for UPC-E. 
  • Industry: Retail 
  • Checksum: Modulo 10 Checksum 

2. EAN Numerical & Quantitative Identification System  

EAN barcodes (European Article Numbers) serve as an international standard for identifying retail products and function as a global counterpart to the American Universal Product Code (UPC). EAN barcodes originated in Europe; however, they have become the predominant form of product identification worldwide. 

 The EAN-13 is the most commonly used EAN barcode and encodes 13 numerical digits. The components of an EAN-13 barcode include a prefix (indicating the country/region), the manufacturer’s code, the product code, and a validation digit/checksum. The EAN-8 is an alternative to EAN-13 that is shorter and typically used for small retail items (to conserve space). 

The EAN standard helps maintain consistency across a global supply chain, enabling seamless scanning during the order process across various manufacturers and suppliers worldwide. 

 EAN Barcode Characteristics Overview-  

  • Data capacity: 13 (EAN-13) and/or 8 (EAN-8) digit(s) (as can be encoded) 
  • Industry Application: Retail or Consumer Goods 
  • Checksum Verification: Uses mod10 to verify 
  • Industry Standard: ISO/IEC 15420 
  • Types of EAN: EAN-13, EAN-8 

3. Code 39

Code 39 is one of the earliest alphanumeric barcode symbologies and is still widely used by various industrial and enterprise companies. While both UPC and EAN use only numerical digits for their identification systems, Code 39 supports both numbers and upper-case letters (which makes it a good choice for internal tracking systems). 

Common uses of Code 39 include automotive manufacturing, defense, and logistics, where ensuring good readability and reliability take priority over using a small, compact design. Code 39 is often printed alongside human-readable text (underneath) to enable manual verification as needed. 

Due to their lower data density, Code 39 Barcodes are longer than those of many other coding standards, which limits their use on smaller labels. 

 Code 39 Features 

  • Can be used to encode: Alphanumeric (A-Z, 0-9, Limited Characters) 
  • Industries that use this Code standard include: Manufacturing, Automotive, Defense, and Logistics. 
  • A Checksum: Optional 
  • Code 39 Standard ISO/IEC 16388 
  • Variants of Code 39: Standard Code 39, Full ASCII Code 39 

4. Code 128  

Code 128 is a linear barcode with a high data density. This bar code can encode more characters and/or more data in a compacted format. 

Code 128 supports the full ASCII character set, and dynamically switches between character subsets to maximize the amount of data that Code 128 can encode.  

These features make Code 128 an ideal barcode format for logistics operations, including shipping and receiving, as well as in warehouse settings where users need to encode both numeric and alphanumeric data efficiently. 

In fact, even though the primary use of code 128 outside of retail is as an identifying and tracking method for couriers and freight systems. 

Code 39 vs Code 128: Code 39 prioritizes simplicity and readability, while Code 128 prioritizes efficiency, compactness, and data capacity. 

Code 128 Overview Features  

  • Can be used to encode: all 128 characters of the ASCII character set 
  • Type of Industry that uses code 128: Logistics, Warehousing, Transportation 
  • Code 128: Mandatory Checksum 
  • Code 128: Standard ISO/IEC 15417 
  • Variations of Code 128: Code Set A, B, C 

Interleaved 2 of 5 (ITF) is a Numeric-only Barcode extensively used throughout distribution to label cartons or packages. ITF is particularly well-suited for printing onto corrugated paper, where print quality may not be very controlled. 

The Intelligent Technology Foundation (ITF) is a method of encoding numeric data using pairs of values. This process enables efficient numeric representation of products while being durable enough for industrial use. ITF is typically seen on packages or pallets, rather than on individual consumer products.   

Here is an overview of what ITF is:   

  • Data only: Numeric  
  • Industries that use ITF: Packaging, warehousing, logistics  
  • Checksum: Optional  
  • Standard Code: ISO/IEC 16390  
  • Variations: ITF-14   

5. Code 93

Code 93 provides a more compact and reliable alternative to Code 39. Code 93 uses a similar character set as Code 39, but with much more density and improved error detection and correction.  

While the overall use of Code 93 is not high, it has found limited use in logistics and in internal enterprise applications, particularly when an organization wants to use less space to represent a barcode than a standard 2D code would require.  

Code 39 Features:  

  • Data stored: Alphanumeric  
  • Industries that use Code 93: Logistics, Internal Tracking  
  • Checksum: Required (2 Character)  
  • Standard: ANSI MH10.8M  
  • Variations: Standard Code 93  

6. Codabar  

Codabar is an older symbology still used in certain settings, such as libraries, blood donation facilities, and some legacy logistics systems. Codabar makes printing and decoding easy, with little to no computers required for either.  

While most barcode types have replaced Codabar, it still has a place in systems where companies require backward compatibility. 

Although updates to Codabar helped make it compatible with more contemporary barcode formats, it remains in use where backward compatibility with existing systems is necessary. 

CODABAR: Overview of Characteristics 

  • Data Capability: Numeric, includes a limited number of symbols. 
  • Industries Utilized by the Code: Libraries, Health Care, Legacy Systems. 
  • Checksum: Not Required 
  • Standard Used by the Code: ANSI/AIM BC3 
  • Variations of the Code: Codabar 

 7. GS1 DATABAR 

 GS1 DataBar is a compact barcode designed for retail applications that require more product-related information than standard UPC or EAN codes. Examples of this type of barcode include vegetables or fruits, gift certificates, or items sold by weight. 

Unlike traditional retail barcodes, the GS1 DataBar can encode product attributes, such as weight, selling price, and expiration status. Therefore, with the use of GS1 DataBars, retailers will be better able to maintain accurate inventory and improve checkout procedures.  

GS1 DATABAR: Overview of Characteristics 

  • Data Capability: Numeric includes Application Identifiers (AI). 
  • Industries Utilized by the Code: Retail and Grocery. 
  • Checksum: Required 
  • Standard Used by the Code: GS1 General Specifications 
  • Variations of the Code: Omnidirectional, Expanded, Truncated. 

8. MSI PLESSEY 

The MSI Plessey is a numeric barcode designed primarily for warehouse inventory control and retail back-office systems. It is easy to implement and is a good choice in a closed-loop environment where global standards are not necessary. 

  • MSI PLESSEY: Overview of Characteristics 
  • Data Capability: Numeric Only 
  • Industries Utilized by the Code: Warehouse and Inventory Management 
  • Checksum: Not Required 
  • Standard Used by the Code: MSI Specification 
  • Variations of the Code: MSI-10 and MSI-11 

Types of Barcodes: 2-D Barcodes  

 1. QR Codes 

A QR code is a 2-D barcode that can store large amounts of information in a compact square. QR codes are used in many ways across marketing, payments, authentication, and consumer interaction because of their compatibility with smartphone cameras.  

 The QR Code’s data-encoding capabilities enable businesses to encode URLs, text, identifiers, and structured data, making them ideal for both consumer and business applications.   

Support for Data:  

  • Data Types: Numeric, Alpha, Binary 
  •  Industry use: Marketing, Payments, Retail, Manufacturing 
  •  Error Correction: Built-in error correction with 4 levels 
  •  Standard: ISO/IEC Standard 18004 
  •  Barcode Variation: Model 1, Model 2, Micro QR  

2. Data Matrix Code  

Data Matrix code design can hold a high density of data in a small amount of space ideal for the manufacturing, electronics, and healthcare industries for Direct Part Marking (DPM).  

Data Matrix codes facilitate accurate decoding even when they sustain partial damage, making them well-suited for the harsh working conditions common in the manufacturing industry. 

Support for Data:  

  • Data Types: Numeric, Alpha, Binary 
  • Industry use: Manufacturing, Healthcare, Electronics 
  • Error Correction: ECC 200 
  • Standard: ISO/IEC Standard 16022 
  • Barcode Variation: ECC 200  

3. PDF417 Code  

PDF417 is both a stacked linear barcode and is capable of holding large volumes of information. The PDF417 code is popular on shipping materials, government-issued identification cards, and transportation documents. 

PDF417 can hold a large amount of data and is often used to add detailed information directly to the barcode. 

 Features of PDF417 at a glance: 

  • Data Capabilities – Text + Binary + Images  
  • Industries – Logistics, Government, Transportation  
  • Built-In Error Correction – Reed-Solomon  
  • Standards – ISO/IEC 15438  
  • Variations –Standard PDF417 + MicroPDF417  

4. Aztec Code: 

The Aztec Code is a compact 2D barcode that helps with easy decoding without a quiet zone. Its primary use is for ticketing and mobile boarding passes. 

 Its compact design makes it suitable for digital displays, and its durability ensures it remains effective even on low-quality printed materials. 

Features of Aztec Code at a glance: 

  • Data Capabilities – Numeric + Alphanumeric + Binary  
  • Industries – Transportation + Ticketing  
  • Built-in error correction  
  • Standards – ISO/IEC 24778  
  • Variations – Aztec + Compact Aztec  

Choosing the Right Barcode for Your Needs.  

Choosing the right barcode for your needs depends on many factors. There is no standardized “one-size-fits-all” barcode that you can use for every application. 

Some of the factors to consider when making your decision are;  

  1. How much data do you want your barcode to store? 
  2. Where will your barcode be printed? 
  3. Where do I plan to scan my barcode? 

Are there any regulatory or industry requirements related to the use of barcodes? Important considerations when selecting a barcode include:

  • Amount of Data – Number or numeric + alphabetic + metadata  
  • Scanning Environment – Type of light, scanning distance, and speed  
  • Label Size and Surface Area – Small parts or large packages  
  • Durability – Damage, abrasion, or distortion of the barcode  
  • Compatible With Devices – Hand-held scanner, camera, and/or mobile device  

Compliance With Regulations Or Industry Standards – GS1, Industry mandates, or local, state, or federal regulations. 

Industry-Specific Barcode Types 

The types of barcodes used in different industries can vary. Here are the most common barcodes by industry: 

  • Retail (UPC, EAN, GS1 DataBar) 
  • Logistics/Warehousing (Code 128, ITF, PDF417) 
  • Manufacturing/Automotive (Data Matrix, Code 39) 
  • Healthcare (Data Matrix, QR) 
  • Marketing/Payments (QR codes) 
  • Transportation (Aztec, PDF417) 

Implementing Barcodes – Step-by-Step Guide 

Step 1: Identify Your Use Case 

Determine the ideal barcode to track: products, parts, assets, documents, or shipments. 

Step 2: What Type of Barcode Should You Use? 

Once you identify the number of items to label, you can determine whether to use a 1D or 2D barcode based on the data volume per item, the available label space, and the scanning location. 

Step 3: What Are the Printing and Labeling Conditions? 

Choose printing and labeling methods with the appropriate quality and durability for real-world usage conditions. 

Step 4: How Will You Verify the Scanner’s Compatibility with Your Barcode? 

Test the barcode against every type of scanner to ensure it scans barcodes in your organization. 

Step 5: How Will You Test, Monitor, and Scale the Barcode System? 

Run a pilot program to test the accuracy of scans and revise the process before moving forward with the full implementation of the barcode system. 

In Summary  

Barcodes may seem like a simple tool, but when you need to choose the right type of barcode for your organization, it can have a HUGE impact on your operational efficiency, compliance, scalability, and data-capture accuracy. 

Understanding the various barcode types, their strengths/weaknesses, and how they work will help you create a barcode strategy that enables you to grow your organization rather than create a bottleneck. 

Barcodes don’t just store data; if used correctly, they can provide your entire organization with improved visibility into its operations, faster inventory movement, and greater confidence in the integrity of your inventory. 

Categories
Tire Sidewall

How Tire Recycling Companies Can Avoid Costly Compliance Fines in 2025

Executive Summary


In 2025, U.S. tire recyclers face tightening state and federal compliance requirements for waste tire transportation, storage, and recycling documentation. Manual recordkeeping and paper manifests are no longer sufficient to meet evolving mandates from agencies such as CalRecycle (California), TCEQ (Texas), and the EPA.

To stay compliant and profitable, tire recyclers are turning to AI-powered scrap tire scanning that automates tire identification, helps with manifest preparation and reporting. These solutions deliver real-time data accuracy, audit-ready documentation, and end-to-end visibility reducing compliance costs and eliminating the risk of fines.

By leveraging AI, recycling facilities can digitize their compliance workflows, streamline manifests, and ensure consistent reporting accuracy, while maintaining data privacy and operational efficiency. Human oversight remains essential for interpreting context and validating data integrity, ensuring that automation supports not replaces regulatory accountability.

The 2025 Compliance Landscape for Tire Recyclers

State and Federal Oversight Intensifies

  • CalRecycle mandates hauler registration, manifests for loads of 10+ tires, and electronic trip logs for waste tracking.
  • TCEQ (Texas) enforces annual reporting and digital manifesting under its Scrap Tire Program.
  • Colorado’s 6 CCR 1007-2 regulation requires manifests and 3-year record retention for all generators and recyclers.
  • EPA sustainability frameworks are pushing for digital waste tracking systems across multiple industries by 2025.

Key Compliance Risks

  • Missing or incomplete tire manifests.
  • Incorrect or unreadable DOT codes on sidewalls.
  • Inconsistent reporting between transporters and processors.
  • Lost paper documentation during audits.

Fines can reach $25,000 per violation with additional penalties for repeat offenders.

AI-Powered Compliance: The New Standard

AI is transforming compliance from a reactive reporting task into a proactive, automated process.

Automated Tire Identification

  • AI tire sidewall scanners capture DOT codes, brands, and serial details in real time.
  • Visual intelligence models identify sidewalls even under dirt, damage, or low light.
  • Each scan produces structured, tamper proof digital data ready for audit review.

Manifest Generation and Reporting

  • AI solutions like Scanflow compile captured data into complete digital manifests, automatically linking:
  • Source and destination facilities.
  • Transporter identification and load IDs.
  • Timestamped scan logs and batch summaries.
  • Helps create manifests that align with CalRecycle’s CTL and TCEQ reporting templates, minimizing administrative overhead.

Predictive Compliance Monitoring

  • AI flags missing tire counts, duplicate records, and data anomalies before audits.
  • Dashboards track real-time compliance performance, providing alerts for immediate correction.

Operational Transformation with AI Tire Scanning

Speed, Scale, and Precision

AI scanning enables tire processors to access huge volumes of tires, integrating seamlessly into existing systems.

  • Continuous scanning ensures uninterrupted workflow.
  • Batch-level reporting aggregates data for bulk shipments.
  • Local (on-device) processing ensures immediate feedback and no internet dependency.
  • All data is processed locally for full offline capability.
  • Meets EPA, GDPR, and state-level data privacy standards.

Business Impact: Turning Compliance into Competitive Advantage

AI tire scanning isn’t just about avoiding fines it’s a strategic investment in efficiency and growth.

Outcome AI-Driven Impact
Faster Operations 60–70% increase in throughput via automation.
Fewer Errors 80% reduction in data discrepancies and reporting mistakes.
Improved Audit Readiness Instant manifest retrieval and clean digital records.


By embedding AI into daily recycling operations, companies gain a long term edge in both compliance reliability and operational agility.

Optimizing Compliance Workflows with Scanflow

Scanflow’s Tire Sidewall Scanner helps recyclers implement digital compliance seamlessly through:

  • Hardware Integration: AI tire sidewall scanners retrofit easily into systems and inspection lines.
  • Data Dashboards: Real-time monitoring of tire inventory, shipment progress, and manifest status.
  • Reporting: Export-ready files compatible with CalRecycle, TCEQ, and EPA databases.
  • Predictive Insights: Early warnings for potential non-compliance issues.

This makes compliance visible, measurable, and verifiable turning regulatory obligations into process efficiency.

Practical Benefits for Tire Recyclers

  • Faster Audit Response: Generate digital manifests in seconds; auditors get clean, timestamped data instantly.
  • Lower Administrative Overhead: Reduce manual documentation and repetitive data entry, freeing staff for higher-value tasks.
  • Scalable and Flexible: Works across multi-site operations, from regional haulers to national recycling networks.
  • Real-Time Compliance Assurance: Get notified the moment a record goes missing or a data mismatch occurs.

Conclusion: The Future of Tire Recycling Compliance

AI is redefining how compliance is achieved, managed, and measured. By integrating tire sidewall scanning and automated manifest generation, recyclers can eliminate manual errors, reduce risk, and build transparency across their operations.

In 2025, compliance isn’t just about meeting regulations it’s about leading with precision, trust, and innovation. Scanflow enables recyclers to do exactly that.

Book a Demo with Scanflow

Regulatory compliance doesn’t have to slow your business down. With Scanflow, you can automate compliance tracking, manifest creation, and audit reporting all in real time.

👉 Book Your Demo at Scanflow

Categories
Text Scanning Tire Sidewall

Scanflow Tire Sidewall Capture: Deep Technical Insights

Scanflow’s tire sidewall scanning system harnesses mobile edge offline SDK that supports for both Android, iOS, Web and API which accurately and efficiently extract critical information such as DOT, size, model number, and brand from real-time images using smartphones and tablets. This article presents a technically robust account of each pipeline stage, relevant algorithms, and formulaic logic.

System Architecture: Edge-Driven Pipeline

Device & Data Capture Layer

Operators use a mobile app integrated with the Scanflow SDK. Images of the tire sidewall are captured using the built-in camera, under varying environmental conditions (light, dust, wear).

Real-time pre-processing ensures noise reduction and optimal imaging

Iproc = Enhance (Iraw), where Iraw is the input image and Iproc is the denoised, contrast-adjusted output.

Pre-processing workflow for tyre sidewall capture using the Scanflow Core SDK on mobile devices which has Scanflow Customized AI Camera. This step is critical, only high-quality frames make it to later stages, so scanning accuracy starts here.

The app uses Scanflow’s SDK (ScanFlowCameraSession, ScanTrustCameraManager)

    • Requests camera permissions and ensures device orientation (typically portrait).
    • SDK manages autofocus, torch (flash), and zoom, adapting dynamically (for low-light correction, centering prompts, etc.).

Frame Filtering Algorithms:

Every frame is rapidly checked with a sequence of filters:

Sharpness Detection

Uses algorithms like Laplacian variance: computes edge sharpness. If variance is below a threshold, frame is too blurry and discarded.

S=Var(∇2I)

Where S is sharpnes, I frame image.

Motion Blur/Artifact Check

Simple frame-to-frame comparison assesses motion using optical flow or frame difference. If the tyre area shifts too much between frames, it’s rejected.

Exposure and White Balance:

Frames under- or over-exposed (too dark/bright) are detected with pixel intensity statistics:

Only frames passing ALL filters are sent to model inference (segmentation/OCR).

for (Frame frame : cameraBuffer) {
    if (!isSharp(frame)) continue;
    if (isMotionBlurred(frame)) continue;
    if (!hasGoodContrast(frame)) continue;
    if (!isProperlyExposed(frame)) continue;
    if (!isCentered(frame)) continue;
    processFrame(frame); // Pass to segmentation & OCR
}

Image Segmentation & Region of Interest (ROI) Detection

The SDK’s CV engine applies edge detection and region heuristics (Canny, Hough, and deep learning models) to localize key regions:

ROI = (Iproc) ROI = Detect (Iproc)

Segmentation leverages Custome model architectures for instance localization.

Optical Character Recognition (OCR)

    • The cropped sidewall region is processed by a custom OCR model (typically CRNN or CRAFT), tuned on embossed/engraved, low-contrast, and worn characters.
    • Each character in the region outputs a probability vector:

P(ci) = Softmax(zi)

      • The recognized string S is constructed: S=Concat(argmax(P(ci))
  • DOT, TIN, size, and serial/model numbers are extracted using regular expressions and neural attention layers:

DOT = RegexSearch( S, DOT pattern )

Size= RegexSearch( S, Size pattern )

Manufacturer/brand is classified via context signals and dictionary lookups.

Semantic Parsing & Data Structuring

Extracted entities are tagged and validated:

Week/year codes from DOT (e.g., 4-digit decode: YYWW)

Size pattern (Width/Aspect Ratio R Diameter), matched by regex or neural text extraction

Model number filtered by fuzzy match to database records

The feature vector:

Vtire = [DOT, Size, Model_No, Brand]

Local Edge Validation & Timestamping

All critical data is validated on-device using checksum algorithms and cross-checks with reference datasets:

Valid = fcheck( Vtire, DBtire )

Timestamp and geotag are appended for traceability.

Edge Custome Model: Tuning for Tire Sidewall Capture

Model Training & Optimization

Training images are annotated for texture, contrast anomalies, and typical defect cases. Trained with 1 Million data sets

Loss functions combine categorical cross-entropy (for OCR) and segmentation IOU

Ltotal=αLocr+βLiou

Dataset diversity (thousands of brands, types, conditions) ensures generalizability and noise resilience.

The Mobile models are quantized using for real-time, low-latency inference (<300ms typical).

The mobile will completely run on edge with Offline capability for field/yard use.

Data Usage in Model Training

The foundation of Scanflow tire sidewall scanning model lies in meticulously collected, annotated, and curated datasets, incorporating diverse real-world edge cases. The dataset is used for training various AI models that perform segmentation, text detection, and recognition in a multi-stage pipeline:

  • Input Data: Raw images and video frames captured from mobile cameras under differing lighting, angles, and tire wear conditions.
  • Annotations: Detailed bounding boxes, segmentation masks, and character-level labels enable supervised learning.
  • Augmentation: On-the-fly data augmentations such as rotation, scaling, illumination changes, blurring, and noise simulate real-world scanning variations.
  • Validation Sets: Separate from training, used continuously across epochs for hyperparameter tuning and generalization checks.

Multi-stage Training

  • Stage 1: Backbone Feature Extraction
    • Model: Stabilize and standardized based model architectures.
    • Purpose: Learn low-level and high-level image features common to tire sidewalls.
  • Stage 2: Segmentation Training
    • Loss Functions:
      • Classification loss (Lcls) using cross-entropy.
      • Bounding box loss (Lbox) via Smooth L1 or IoU.
      • Mask loss (Lmask) using binary cross-entropy for pixel-wise predictions.

L=Lcls+Lbox+Lmask

Data Privacy and Security For Enterprise System Integration

  • Scanflow SDK primarily performs on-device processing, ensuring raw images and processed data never need to leave the mobile device.
  • Data export is user-controlled, encrypted, often only metadata or interpreted text is sent to cloud or backend systems.
  • Secure key management for SDK licenses maintains system integrity.
    • Local Processing: Scanflow performs all essential OCR and image processing on the mobile device (edge), eliminating the need to send raw images or sensitive data over the network initially.
    • Volatile Memory Storage: Images and intermediate data are kept only in volatile memory buffers during scanning sessions.
    • Immediate Data Purge: Raw capture frames and temporary data buffers are wiped securely immediately after recognition.

Comparison statistics report of Scanflow and other Commercial SDKs available in Market.

Here is a comparative chart that illustrates the stability, accuracy, and performance (speed) of the Scanflow SDK versus three other commercial tire sidewall scanning SDKs. The values are on a 0-100 scale based on typical reported benchmarks and user feedback:

  • Scanflow leads across all three parameters with high stability (92), accuracy (95), and performance (90).
  • Competitor A follows with decent but lower metrics.
  • Competitors B and C lag further behind, especially in accuracy and performance.

This visual comparison helps users quickly comprehend how Scanflow excels in delivering reliable, accurate, and fast tire sidewall scanning.


  • Stability indicates how consistently the SDK performs across different tire types, environmental conditions, and mobile devices.
  • Accuracy measures the precision of extracted data like DOT codes, size, model numbers.
  • Performance refers to inference speed and responsiveness on edge devices (mobile phones).

Users can visualize Scanflow outperforming competitors on all three parameters, indicating reliability and speed combined with superior detection accuracy.

Such a chart helps technical users quickly assess and compare SDK capabilities for integration or evaluation purposes. If needed, this can be presented as a grouped bar chart with distinct colors per metric for clarity.

Let’s take a comparison metrics with leading Competitor A SDK.

Metric / Condition Scanflow Competitor A Scanflow Advantage
Overall Accuracy 96.6% 85.1% ✅ +11.5% higher accuracy
Old & Glared Tyres 100% Not specified ✅ Proven capability on aged/glared surfaces
Blurred Images 86% 54% ✅ Handles blurred captures (partial recovery possible)
Accuracy in Challenging Conditions Very High Low ✅ Robust in difficult lighting/angles
Consistency Across Conditions Very High Moderate ✅ Reliable across varying scenarios

Scanflow Leading Metrics (Compared to Competitor A)

Criteria Scanflow Competitor A Scanflow Advantage
Tyre Compatibility Works on any tyres Car tyres only ✅ Universal tyre support
Blurry Image Handling Excellent Poor ✅ Handles low-quality images effectively
Challenging Conditions Handles well Struggles ✅ Robust under real-world conditions
Offline Support ✅ Fully Offline ❌ Requires Internet ✅ Works without connectivity
DOT Code ROI Handling More flexible Very narrow ROI box ✅ Adapts better to varying code areas
Partial Value Return ✅ Returns partial values ❌ Not supported ✅ Can decode incomplete DOT codes
Text Angle Handling Tolerates a range of angles Best when perpendicular ✅ Works across multiple orientations
Default Camera Mode Uses wide-angle (may need tuning) Neutral ✅ Broader field

Summary

Scanflow’s tire sidewall scanning SDK combines cutting-edge AI models, mobile-optimized processing, comprehensive and accurate data extraction, and seamless integration, backed by industry-leading stability and performance. These technical strengths ensure developers and businesses gain a robust, future proof solution, minimizing operational friction while maximizing insight and efficiency making Scanflow an unmatched choice in the tire scanning ecosystem.

Scanflow delivers enterprise-grade reliability, accuracy, and resilience, positioning itself as the most advanced and deployable tire sidewall scanning SDK in today’s market.

Categories
Tire Sidewall

How Ohio Manufacturers Use Tire Sidewall Scanning to Eliminate Tire Mix-Ups

Tire Sidewall Scanning Prevents Mix-Ups in Ohio Tire Plants


Introduction

Ohio’s manufacturing sector has long been a backbone of North America’s automotive supply chain. With multiple tire plants, distribution hubs, and assembly-line operations powering the region, accuracy in tire identification has never been more important. As production volumes grow and SKU diversity increases, manufacturers face a familiar yet costly challenge: tire mix-ups. A single mismatched tire in a vehicle build sequence can trigger delays, rework, or full unit stoppage. Worse, recurring mix-ups compromise quality assurance, supply-chain visibility, and OEM confidence.

To solve this, Ohio manufacturers are turning to tire sidewall scanning. Instead of relying on printed labels that fall off, spreadsheets that drift out of sync, or manual reading of molded characters, they deploy AI-driven sidewall text recognition that instantly identifies each tire based on the information molded into its rubber. This creates a consistent, digital source of truth that follows every tire through receiving, storage, picking, and assembly-line fitment.

In this article, you’ll learn how sidewall scanning works in a real manufacturing environment, how it eliminates SKU mismatch events, and how Ohio facilities integrate it with warehouse workflows, MES systems, and quality gates. You’ll also see why sidewall scanning is evolving into a core capability for lean operations, automotive compliance, and production accuracy.


1. The Problem: Tire Mix-Ups and Manual Identification Risks


1.1 Why Manual Identification Fails in Modern Manufacturing

Many tire facilities still depend on processes developed decades ago: reading molded text by eye, matching tires to work orders manually, or trusting labels attached at receiving. These methods introduce several risks:

  • Labels detach, smudge, or become unreadable during handling.

  • Manually reading molded text leads to fatigue, misreads, and inconsistent accuracy.

  • Inventory data becomes outdated when tires are moved without proper scanning.

  • Assembly-line pickers select from visually similar tires, assuming they match.

As model diversity expands all-season, all-terrain, specialty lines, variances in size, load index, speed rating visual similarity becomes misleading. Human operators must interpret dozens of near-identical tires at high speed. Errors inevitably occur.

1.2 The True Cost of Tire Mix-Ups

A wrong tire reaching the assembly line can trigger:

  • Line disruptions and sequencing failures.

  • Unplanned rework or scrapping.

  • Delayed vehicle shipments.

  • Quality-control investigations.

  • Damaged supplier reputation with downstream OEMs.

Even when caught early, mix-ups consume time and create traceability gaps. Without a verifiable digital record of which tire went where, audits and root-cause investigations become slow and uncertain.


2. What Tire Sidewall Scanning Actually Is


2.1 AI Text Recognition for Molded Sidewall Characters

Tire sidewall scanning uses computer vision to read the molded text already present on every tire, including:

  • Tire size

  • Model

  • Load index

  • Speed rating

  • DOT-coded information

  • Manufacturing identifiers

  • Other alphanumeric markings

This method does not rely on printed labels, RFID tags, or externally applied markers. Instead, it captures the tire’s inherent information as the basis of identification.

2.2 Why This Approach Works Better Than Legacy Solutions

Because molded sidewall characters cannot fall off or degrade in the same way printed labels do, sidewall scanning ensures:

  • A permanent, tire-native identifier

  • Reliable recognition even after extended storage

  • Uniform accuracy regardless of storage conditions

  • Consistency across suppliers, plants, or batches

This makes sidewall scanning ideal for Ohio plants dealing with tight production timelines and diverse tire inventories.


3. How Sidewall Scanning Prevents Mix-Ups in Ohio Plants


3.1 Eliminating Human Interpretation Errors

Operators no longer read molded text manually. Instead, sidewall scanning instantly identifies the tire and checks whether it matches the expected SKU in the current workflow step. If not, the system blocks the move or triggers an alert.

3.2 Enhancing Warehouse Accuracy

In receiving, storage, and picking, scanning ensures:

  • Tires are placed in the correct bin or rack.

  • Inventory entries match the actual tire delivered.

  • Real-time visibility shows exactly where each SKU is located.

This prevents the root causes of mix-ups before tires even reach the assembly line.

3.3 Guaranteeing Fitment Accuracy on Assembly Lines

During assembly-line operations, scanning confirms:

  • The tire picked matches the vehicle’s build specification.

  • No alternative or wrong SKU can be fitted without detection.

  • A digital record links each tire to each vehicle build.

This creates a traceable, error-proof fitment process.


4. Integration in Ohio Manufacturing Environments


4.1 Retrofitting Existing Warehouses

Ohio facilities often operate mixed-age infrastructures. Fortunately, sidewall scanning:

  • Works with handheld devices, fixed gate stations, or mobile workstations.

  • Requires no dismantling of existing racks or conveyors.

  • Integrates into workflows without slowing throughput.

Plants can deploy scanning in phases: receiving first, then picking, then assembly.

4.2 Connecting with MES, ERP, and QMS Platforms

Scanflow’s sidewall scanning solution integrates with key production systems, allowing tire identification data to synchronize automatically. This enables:

  • Automated work-order validation

  • Real-time exception handling

  • End-to-end traceability

  • Error-proof production sequencing

For Ohio OEM-supplier plants, this ensures alignment with major automotive compliance requirements.

4.3 Reducing Reliance on Printed Labels

Printed labels create bottlenecks. They require printers, supplies, maintenance, and manual application. Sidewall scanning removes these dependencies entirely.


5. A Realistic Workflow: How Scanflow Operates in Practice


5.1 Step 1: Receiving Verification

When a shipment arrives:

  • Operators scan each tire.
  • The system reads the molded characters.
  • The tire is automatically matched to the purchase order.
  • Any mismatch size, model, or supplier discrepancy is flagged before storage.

This prevents incorrect inventory from entering circulation.

5.2 Step 2: Storage and Inventory Tracking

As tires move into racks:

  • Each scan updates the digital location.

  • Inventory accuracy becomes near-perfect.

  • FIFO or batch-based retrieval rules are applied automatically.

This ensures the right tire will be accessible when needed.

5.3 Step 3: Picking and Staging for Assembly

Pickers scan tires as they retrieve them. If a tire does not match the expected SKU on the work order, the system prevents progression. This protects the assembly line from upstream mistakes.

5.4 Step 4: Assembly-Line Fitment Verification

Before fitment:

  • Operators scan again to confirm the tire matches the build spec.

  • The system logs which tire went onto which vehicle.

  • Fitment errors are eliminated, not corrected afterward but prevented entirely.

This creates a clean digital audit trail without manual documentation.


6. Benefits for Quality Control and Assurance


6.1 Real-Time Validation of Every Tire Movement

Instead of periodic audits, every tire movement becomes a verification point. The system confirms identity at:

  • Receiving

  • Storage

  • Picking

  • Staging

  • Fitment

This protects both product quality and process consistency.

6.2 Traceability from Batch to Vehicle Build

Sidewall scanning ensures every tire carries a digital fingerprint. When recorded through MES integration, manufacturers can trace:

  • Which batch a tire came from

  • When it entered storage

  • Who picked it

  • Which vehicle it was fitted to

This level of lineage strengthens compliance, quality audits, and supplier transparency.

6.3 Eliminating Paper Logs and Manual Recording

Ohio plants often juggle a mix of paper sheets, spreadsheets, handwritten notes, and emails. Sidewall scanning centralizes everything into a consistent digital record, instantly accessible and editable.


7. Why Ohio Manufacturers Are Adopting This Now


7.1 Rising SKU Complexity

Tire manufacturers now produce:

  • More seasonal variants

  • More specialized applications

  • Wider fitment combinations

Human operators cannot differentiate dozens of similar SKUs reliably over long shifts. Automation fills this accuracy gap.

7.2 OEM Expectations for Traceability

Vehicle manufacturers increasingly demand:

  • Full part-level traceability

  • Digital audit records

  • Real-time reporting

Sidewall scanning helps Ohio suppliers meet these expectations without adding manual workload.

7.3 Lean Manufacturing Alignment

Lean principles require:

  • Predictable flow

  • Zero-defect processes

  • Minimal rework

Sidewall scanning fits naturally into lean systems by eliminating defects at the source.


8. Comparison: Sidewall Scanning vs Traditional Identification Methods


8.1 Printed Labels

Pros: Familiar and cheap to produce.
Cons: Fall off, smudge, or degrade; must be applied manually; generate waste.

8.2 Human Reading of Molded Text

Pros: No equipment required.
Cons: Slow, inconsistent, prone to error, fatiguing for operators.

8.3 RFID

Pros: Good for pallet tracking.
Cons: Costs increase when tagging individual tires; tags can fail or become detached.

8.4 Sidewall Scanning

Pros:

  • Reads the tire’s native identifiers

  • Requires no added labels or tags

  • Prevents mix-ups even in high-speed environments

  • Integrates directly with manufacturing workflows


9. Implementing Sidewall Scanning in an Ohio Facility


9.1 Best Practices

  • Start with a pilot in receiving or picking.

  • Evaluate lighting consistency in scanning zones.

  • Train operators to adopt scanning as a standard step.

  • Integrate with MES for real-time validation.

  • Use dashboards to monitor scan accuracy and exceptions.

9.2 Change Management Considerations

Operators need reassurance that scanning:

  • Speeds up their work

  • Reduces rework

  • Protects them from costly mistakes

Managers should present scanning as empowerment, not oversight.

9.3 Scalability for Multi-Plant Operations

Scanflow solutions support standardized workflows across multiple sites, enabling:

  • Unified data structures

  • Shared audit trails

  • Consistent pick-and-fitment logic


10. ROI: The Business Case for Sidewall Scanning


10.1 Cost Avoidance

Mix-up events create:

  • Lost labor

  • Lost materials

  • Line downtime

  • Quality spillover risk

Sidewall scanning prevents these before they occur.

10.2 Higher Throughput

With scanning:

  • Picking decisions are instantaneous

  • Fitment verification becomes frictionless

  • Exception handling is automated

This maintains flow even in high-volume Ohio plants.

10.3 Stronger Supplier Positioning

Manufacturers using sidewall scanning demonstrate:

  • Commitment to traceability

  • Error-proof fitment

  • Clean audit trails

These differentiate Ohio suppliers in the competitive automotive market.


11. Future Outlook: Where Sidewall Scanning Is Headed


Even without discussing defect detection or advanced diagnostics, the future of sidewall scanning is clear:

  • Deeper integration with plant analytics platforms

  • Automated sequencing with live production schedules

  • Machine learning to improve character recognition over time

  • Plant-wide consistency across receiving, storage, and assembly

Sidewall scanning is not a niche tool. It is becoming a foundational component of modern tire manufacturing.


Quick Takeaways


  • Tire sidewall scanning uses AI-driven reading of molded text to identify tires accurately.

  • It eliminates mix-ups caused by labels, manual reading, or mismatched inventory data.

  • Ohio manufacturers integrate scanning from receiving through assembly-line fitment.

  • It strengthens traceability, compliance, and quality assurance.

  • It aligns with lean principles and increasing OEM expectations.

  • It reduces rework, delays, and SKU confusion in high-volume environments.


Conclusion

Tire mix-ups pose a persistent threat to quality, efficiency, and customer satisfaction in the tire manufacturing and vehicle assembly sectors. As Ohio facilities continue to accelerate production and diversify product lines, reliance on manual identification or printed labels introduces unnecessary risk.

Tire sidewall scanning replaces these outdated methods with a stable, accurate, and fully digital identification process. By reading molded text directly from each tire, plants eliminate guesswork at every step. This creates a closed-loop, reliable system of verification from receiving to storage, picking, and assembly-line fitment.

The benefits are immediate: fewer errors, faster throughput, cleaner audits, and stronger compliance with OEM expectations. Over time, plants adopting this technology gain deeper production intelligence and higher consistency across multi-plant operations.

For Ohio manufacturers seeking a modern solution to long-standing identification challenges, tire sidewall scanning is now an essential capability. It strengthens your quality processes, protects your production flow, and ensures every tire reaches the right vehicle without exception.

If you’re ready to elevate your plant’s accuracy and end SKU mix-ups permanently, explore implementing sidewall scanning with Scanflow today.


We’d Love Your Feedback

Did this article help clarify how sidewall scanning improves accuracy and eliminates mix-ups? What’s the biggest identification challenge your facility faces today? Share your thoughts so we can explore solutions together and feel free to pass this article along to colleagues who might benefit.