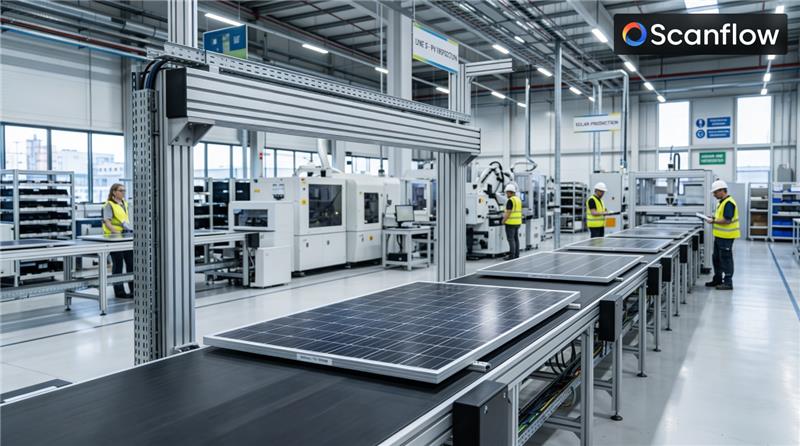
How Solar Panel Manufacturers Lose Warranty Claims Due to Poor Serial Number Tracking
A single missing serial number can void a warranty. Ensuring reliable tracking builds confidence amo...
 9 Mins read
Posted on Jun 10, 2026
July 13, 2026
6 Mins read


The United States is in the middle of the largest solar buildout in its history. Developers are on track to add 43.4 GW of new utility-scale capacity in 2026 alone a 60% increase over the record set just the year before. The U.S. Solar PV Market, valued at roughly $49.7 billion in 2026, is growing at a 13.8% CAGR through 2034. Almost 70 GW of new capacity is scheduled to come online across 2026 and 2027, representing a near 50% increase in total U.S. operating capacity compared to the end of 2025.
The scale is extraordinary. The stakes attached to that scale for project developers, O&M operators, EPC contractors, and asset owners are equally significant. Because underneath the installation numbers is a growing performance problem that the industry has largely failed to solve at scale: defects you cannot see with the naked eye are silently draining yield from billions of dollars’ worth of installed capacity, and most fleets discover them far too late.
Solar panel defects fall into two categories. The first are visible cracked glass, physical delamination at the edge, obvious discoloration. These are immediately identifiable on a standard visual walkdown and can be dispatched for repair or replacement. They are, in the scheme of modern solar operations, the manageable problem.
The second category is more dangerous precisely because it’s silent. Microcracks, hotspots, Potential Induced Degradation (PID), and solder bond failures are largely or entirely invisible to human visual inspection at the time of installation and during standard O&M walkthroughs. They don’t look like anything. A panel with early-stage microcracks appears identical to a healthy module from three feet away, and from three feet is as close as most inspection workflows get.
The performance impact, however, is anything but invisible. Microcracks fractures in the silicon cells that typically measure 0.1 to 5 mm and are completely undetectable without specialized imaging reduce efficiency by approximately 2.5% even before they cause full cell inactivation. As they propagate under thermal cycling stress (panels routinely reach 60–85°C during operation and cool to ambient overnight, a cycle that repeats thousands of times over a project’s life), they escalate into hotspots. Hotspot conditions raise localized surface temperatures by 15–20°C above neighboring cells, accelerating degradation and, in unaddressed cases, creating fire risk.
PID compounds the picture. When high system voltage drives leakage current between the cell and the grounded frame, sodium ion migration into the silicon follows. Studies have found that PID-affected modules can lose 20–30% of rated output within 2–5 years a catastrophic yield loss that would be immediately obvious if it appeared on day one, but develops quietly enough that it often goes undetected through multiple annual inspection cycles.
Faulty soldering, meanwhile, is the manufacturing-origin defect that travels into the field already embedded. A 2026 report based on factory audits conducted across the U.S. domestic solar manufacturing base found that 70% of American factories fell into the lowest quality tiers. Soldering flaws cold solder joints, grid breaks, oversoldering were identified through electroluminescence imaging as among the most prevalent defect types. These flaws directly cause power degradation and hotspot formation, and field research indicates they can reduce project output by 10–30% in affected areas.
The revenue math is not subtle. According to Raptor Maps’ 2025 Global Solar Report, equipment-driven underperformance increased 214% over five years. In 2024, that gap translated to $10 billion in unrealized revenue across the global solar fleet. A 5% undetected yield loss on a single 10 MW site costs approximately $40,000 per year every year until someone finds it.
Extend that across a utility-scale portfolio, or across the 211 GWdc of utility-scale capacity the U.S. is projected to add between 2026 and 2031 alone, and the compounding impact of undetected sub-visual defects becomes one of the most significant unmanaged financial risks in renewable energy infrastructure. These are long-life assets financed on 20- to 25-year project economics and degradation that begins in years 1–3 shapes the entire revenue curve.
The problem is well understood in the O&M community. What has been slower to change is the inspection infrastructure the tools and workflows used to actually find these defects before they’ve been quietly draining yield for months or years.
Standard visual inspection a technician walking module rows is the most common baseline O&M activity across the industry, but it has a fundamental physics problem: the defects that drive the most yield loss are not optically visible under normal conditions. Microcracks require electroluminescence (EL) imaging to reveal. Hotspots require thermal infrared cameras to map. PID requires specialized I-V curve analysis or EL imaging under reverse bias.
Without these tools, a technician walking a 10 MW site with a clipboard is, at best, identifying the 20% of defects that have progressed to visible physical damage. The other 80% the defects in their performance-degrading but physically unremarkable phase simply don’t register.
The bandwidth problem compounds this. A skilled technician performing manual thermal inspection with a handheld camera can cover roughly 1–2 MW per day. A 100 MW utility-scale site, at that rate, takes months to inspect fully. By the time the crew reaches the last row, conditions at the first panels have already changed, and no site-wide snapshot has ever actually existed. At modern project scales where a single installation may run to hundreds of megawatts manual inspection isn’t a comprehensive quality control strategy; it’s a sampling exercise with large gaps.
Inconsistency is the other failure mode. Two technicians inspecting the same thermal anomaly can reach different severity assessments. Shift changes, lighting conditions, and inspector experience levels all introduce variability into a process where consistent, documented, defensible data is exactly what project finance, insurance, and warranty claim workflows require. A qualitative observation entered into a field form is not the same as a georeferenced, classified, severity-rated defect record that feeds into a work order management system.
This is the exact problem that AI-enabled visual inspection is designed to solve. By combining multi-modal imaging thermal infrared, electroluminescence, and high-resolution RGB with computer vision models trained to detect, classify, and severity-rate solar defect types, modern platforms close the gap between what manual inspection can find and what’s actually happening across an installed fleet.
The operational scale advantage is significant. A drone capturing thermal and RGB data can cover a 1 MWp solar site in approximately 8 minutes. AI-powered analysis then processes thousands of images in hours. A 100 MW site inspection that takes 2–3 weeks on foot completes in 2–4 hours with drone-assisted AI capture. Fine-tuned AI defect detection models reach 85–95% mean average precision on focused defect categories hotspot classification, microcrack detection, delamination mapping, string outage identification with false positive rates low enough to make automated dispatch viable rather than a burden on maintenance teams.
What matters beyond speed is consistency and auditability. An AI classification model applies the same defect criteria to the first image and the ten-thousandth no fatigue, no subjective severity drift, no gaps between shifts. Every detected anomaly is georeferenced to an exact panel location, classified by type and severity, tied to a recommended action, and logged in a format that supports warranty claims, insurance documentation, and lender reporting. That’s a qualitatively different data artifact than a technician’s field notes.
Platforms like Scanflow’s Battery Solutions and QC AI Agent capabilities address exactly this workflow: AI-enabled visual intelligence that goes beyond surface-level detection to identify sub-visual defect signatures that standard inspection protocols miss. The underlying value proposition that consistent, image-based AI grading captures performance-critical defects earlier and more reliably than manual processes applies directly to the solar operations context where invisible defects compound over time into measurable, irreversible yield loss.
For asset owners and operators, the financial argument for AI-enabled inspection is straightforward. Defects caught at installation or within the first operating year are typically addressable under manufacturer warranty. Defects caught at year five, after years of degraded yield and potential hotspot-driven damage, often are not. The window between “detectable with the right tools” and “beyond economic repair” is often measured in inspection cycles.
For EPC contractors and project developers, pre-commissioning AI inspection is increasingly a risk management necessity. As corporate buyers and utilities tighten PPA terms and performance guarantees, the ability to document panel-level baseline condition at handover with georeferenced, AI-classified imagery protects against disputes about when a defect originated and who bears responsibility.
For O&M providers operating competitive, performance-based contracts, AI inspection shifts the value proposition from labor-hours-on-site to documented yield protection, which is a significantly more defensible and scalable service offering.
The U.S. solar industry is installing capacity faster than at any point in its history. The economic case for solar is stronger than it has ever been. But generation output the metric that actually determines returns for every stakeholder in the value chain depends not just on how much capacity gets installed, but on how much of that capacity performs to spec over a 25-year project life.
Sub-visual defects are the gap between what’s installed and what performs. They are present at commissioning in a meaningful share of modules. They develop during operation in every fleet, under thermal cycling and environmental load. Left undetected by the inspection tools that can’t find them, they quietly compound. Found early by AI-enabled visual intelligence, they are manageable, documentable, and in many cases fully recoverable.
Solar defects don’t wait until they’re visible to start costing money. Neither should your inspection program.

How Solar Panel Manufacturers Lose Warranty Claims Due to Poor Serial Number Tracking
9 Mins read
Posted on Jun 10, 2026
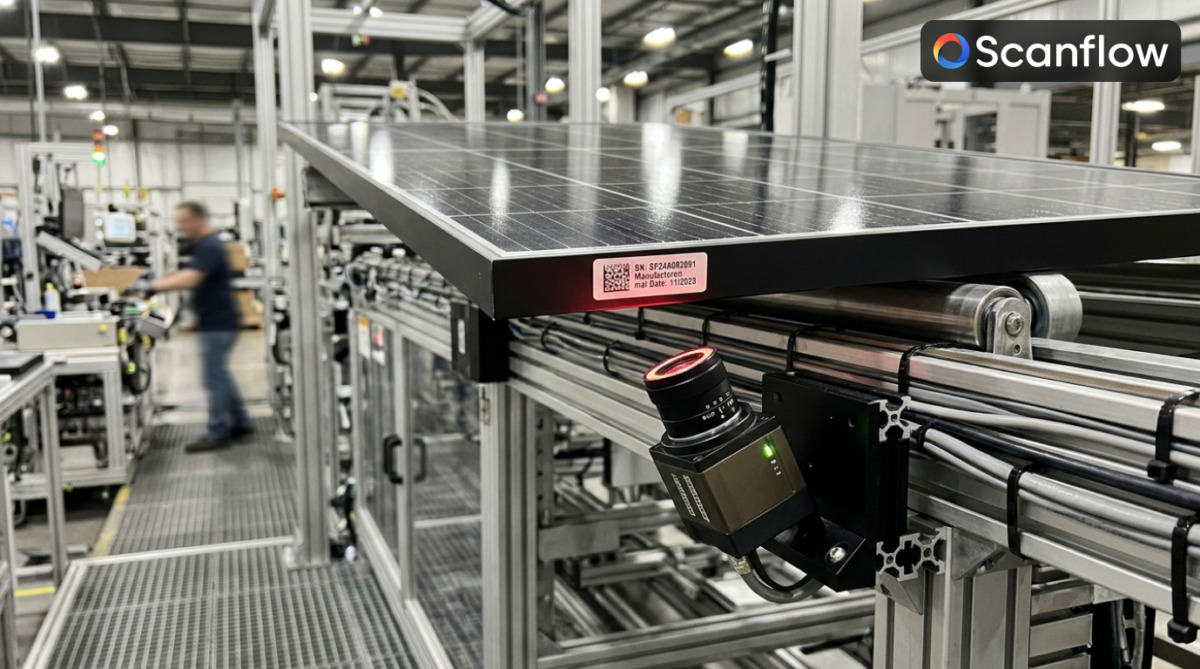
Why Solar Panel Serial Number Traceability Is Critical for Warranty and Claims?
10 Mins read
Posted on Apr 27, 2026